
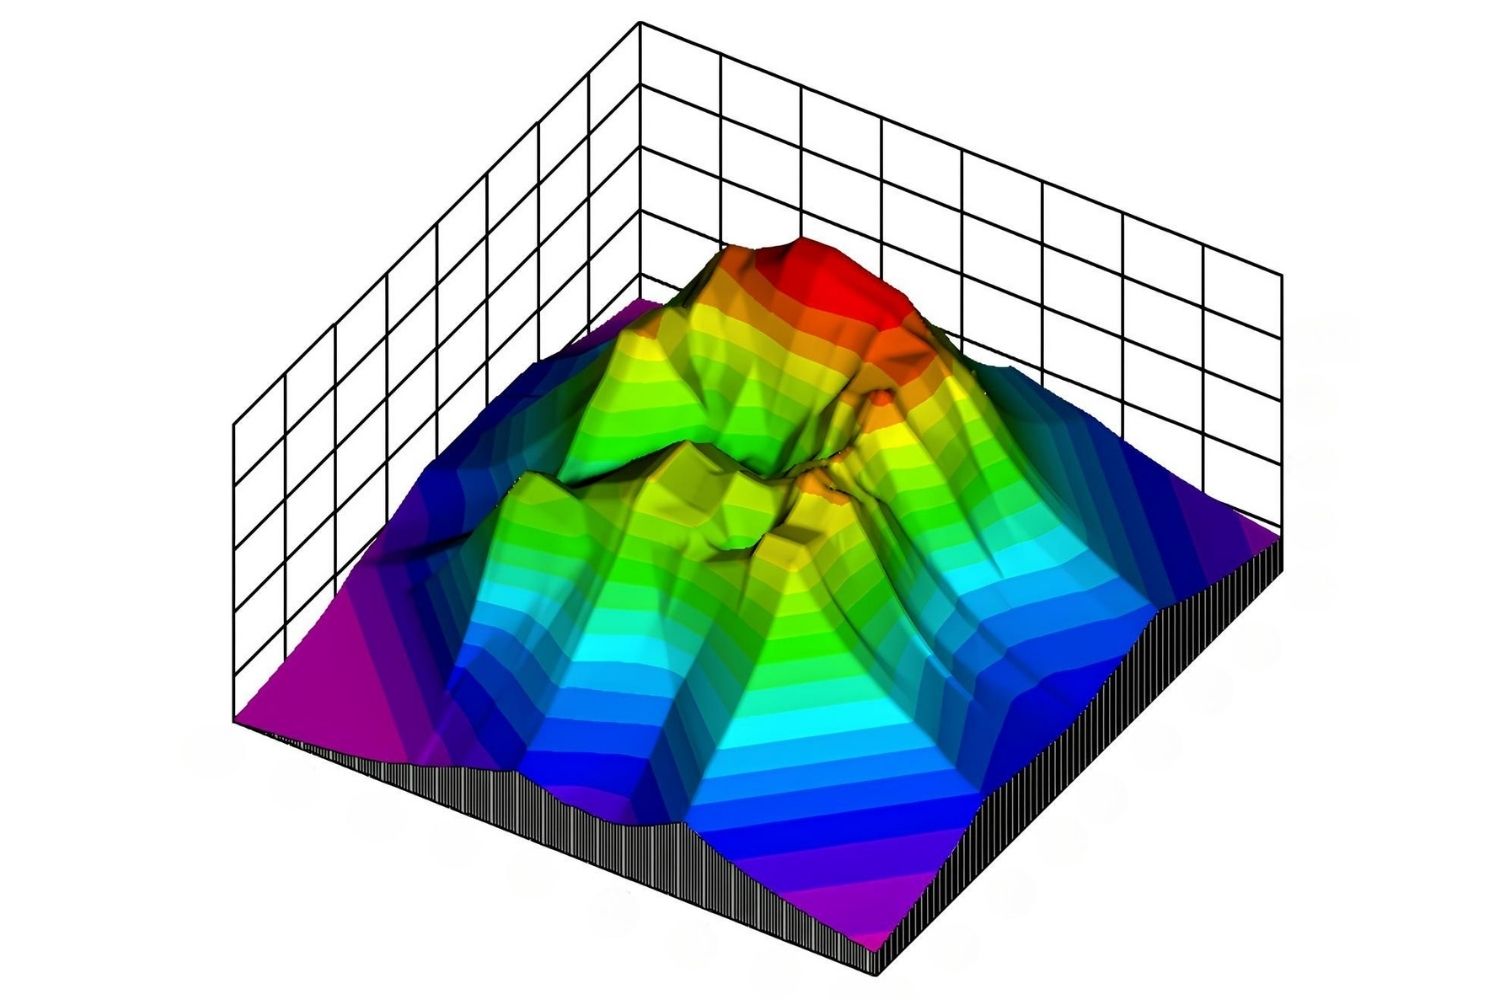
Contour lines are essential tools in geography and cartography, helping us understand the shape and elevation of the land. But what exactly are they? Contour lines are imaginary lines on a map that connect points of equal elevation. They show the height and slope of terrain, making it easier to visualize hills, valleys, and flat areas. These lines are crucial for hikers, engineers, and anyone needing to navigate or understand the landscape. By examining the spacing and shape of contour lines, one can determine the steepness of slopes and the height of mountains. Ready to learn more? Let's dive into 38 fascinating facts about contour lines!
Contour Lines: The Basics
Contour lines are essential in understanding topography. They represent the shape and elevation of the land on maps. Here are some fascinating facts about contour lines:
-
Contour lines connect points of equal elevation. This means every point along a contour line is at the same height above sea level.
-
The spacing between contour lines indicates slope steepness. Closely spaced lines show a steep slope, while widely spaced lines indicate a gentle slope.
-
Contour lines never cross. If they did, it would mean a single point has two different elevations, which is impossible.
-
Every fifth contour line is usually a thicker line called an index contour. These lines often have the elevation written on them for easier reading.
-
Contour lines form closed loops. These loops can represent hills or depressions. If the loop has hachures (short lines inside the loop), it indicates a depression.
Historical Background
Understanding the history of contour lines can give us insight into their development and usage over time.
-
Contour lines were first used in the 18th century. Dutchman Pieter Bruinsz created one of the earliest known contour maps in 1584.
-
The term "contour line" was coined in the 19th century. French engineer Charles Hutton used it while studying the density of the Earth.
-
Early contour maps were hand-drawn. Surveyors used tools like theodolites and levels to measure elevations before drawing the lines.
-
The first topographic map using contour lines was made in 1791. It was created by French cartographer Louis-Alexandre Berthier.
-
Modern contour maps are generated using satellite data. This allows for more accurate and detailed maps.
Practical Uses
Contour lines are not just for maps; they have many practical applications in various fields.
-
Hikers and climbers use contour maps for navigation. These maps help them understand the terrain and plan their routes.
-
Engineers use contour lines in construction projects. They help in designing roads, bridges, and buildings by understanding the land's shape.
-
Farmers use contour lines for soil conservation. Contour plowing follows the lines to reduce soil erosion.
-
Military operations rely on contour maps. They help in planning strategies by understanding the terrain.
-
Urban planners use contour lines for city development. They help in designing drainage systems and preventing flooding.
Reading Contour Maps
Reading contour maps can be tricky, but understanding a few key points can make it easier.
-
Contour intervals are the vertical distance between contour lines. This interval is consistent throughout the map.
-
A contour map's scale is crucial. It shows the relationship between distances on the map and actual distances on the ground.
-
Depression contours have hachures. These short lines point towards lower elevations, indicating a dip in the terrain.
-
Ridge lines are shown by contour lines forming a V or U shape. The point of the V or U indicates the direction of the ridge.
-
Valleys are indicated by contour lines forming a V shape. The point of the V points upstream or towards higher elevation.
Advanced Concepts
For those who want to dive deeper, here are some advanced concepts related to contour lines.
-
Supplementary contour lines are used in flat areas. These dashed lines show minor elevation changes.
-
Form lines are approximate contour lines. They are used when precise data is unavailable.
-
Isobaths are contour lines under water. They show the depth of lakes, seas, and oceans.
-
Isohyets are contour lines that connect points of equal rainfall. They help in studying weather patterns.
-
Isotherms are contour lines that connect points of equal temperature. Meteorologists use them to study climate.
Fun Facts
Contour lines can be fun and surprising too! Here are some interesting tidbits.
-
Contour lines can create optical illusions. When viewed from certain angles, they can appear to form 3D shapes.
-
Artists use contour lines in their work. They help in creating realistic landscapes and topographical art.
-
Video games use contour lines for terrain generation. Games like Minecraft use them to create realistic landscapes.
-
Contour lines can be found on Mars. NASA uses them to study the Martian surface.
-
Some contour maps are works of art. Cartographers often take great care in designing beautiful and accurate maps.
Real-World Examples
Let's look at some real-world examples where contour lines play a crucial role.
-
The Grand Canyon has detailed contour maps. These maps help tourists and researchers understand its complex terrain.
-
Mount Everest's contour map is essential for climbers. It helps them plan their ascent and understand the mountain's challenges.
-
The Appalachian Trail uses contour maps. Hikers rely on these maps to navigate the trail's varied terrain.
-
Contour maps of the ocean floor are used in marine biology. They help scientists study underwater features and habitats.
-
Contour lines are used in disaster management. They help in planning evacuation routes and understanding flood zones.
Technological Advances
Technology has revolutionized how contour lines are created and used.
-
LIDAR technology creates detailed contour maps. It uses laser light to measure distances and create accurate maps.
-
Drones are used to create contour maps. They can fly over areas and capture detailed elevation data.
-
GIS software helps in creating and analyzing contour maps. Geographic Information Systems allow for complex data analysis and map creation.
The Final Shape
Contours shape our world in ways we often overlook. From geography to art, these lines define boundaries, create depth, and bring clarity. Knowing about contours can enhance your understanding of maps, improve your artistic skills, and even help in fields like architecture and engineering.
Remember, contours aren't just lines on a map or a drawing. They represent elevation, depth, and form. They help us visualize the three-dimensional world on a two-dimensional surface. Whether you're a student, an artist, or just someone curious about the world, understanding contours can open up new perspectives.
So next time you look at a map or a piece of art, take a moment to appreciate the contours. They might just reveal a whole new layer of understanding.
Was this page helpful?
Our commitment to delivering trustworthy and engaging content is at the heart of what we do. Each fact on our site is contributed by real users like you, bringing a wealth of diverse insights and information. To ensure the highest standards of accuracy and reliability, our dedicated editors meticulously review each submission. This process guarantees that the facts we share are not only fascinating but also credible. Trust in our commitment to quality and authenticity as you explore and learn with us.