


Written by Emiline Higgs
Modified & Updated: 05 Dec 2024
Reviewed by Jessica Corbett
Phase diagrams are essential tools used by chemists and material scientists to understand the behavior of substances under different temperatures and pressures. These diagrams provide valuable insights into the various phases of matter, such as solids, liquids, and gases, and the transitions between them. While phase diagrams may seem complex at first glance, delving into their intricacies can reveal a wealth of fascinating information. In this article, we will explore 11 intriguing facts about phase diagrams that will broaden your understanding of the remarkable world of chemistry. From the concept of equilibrium to the critical point, these facts will highlight the significance and application of phase diagrams in the field of science. So, let’s dive in and unravel the secrets hidden within these graphical representations!
Key Takeaways:
- Phase diagrams visually show how substances change under different conditions, helping scientists predict and understand phase transitions.
- These diagrams are crucial in chemistry and engineering, providing insights into phase stability, behavior, and transformations.
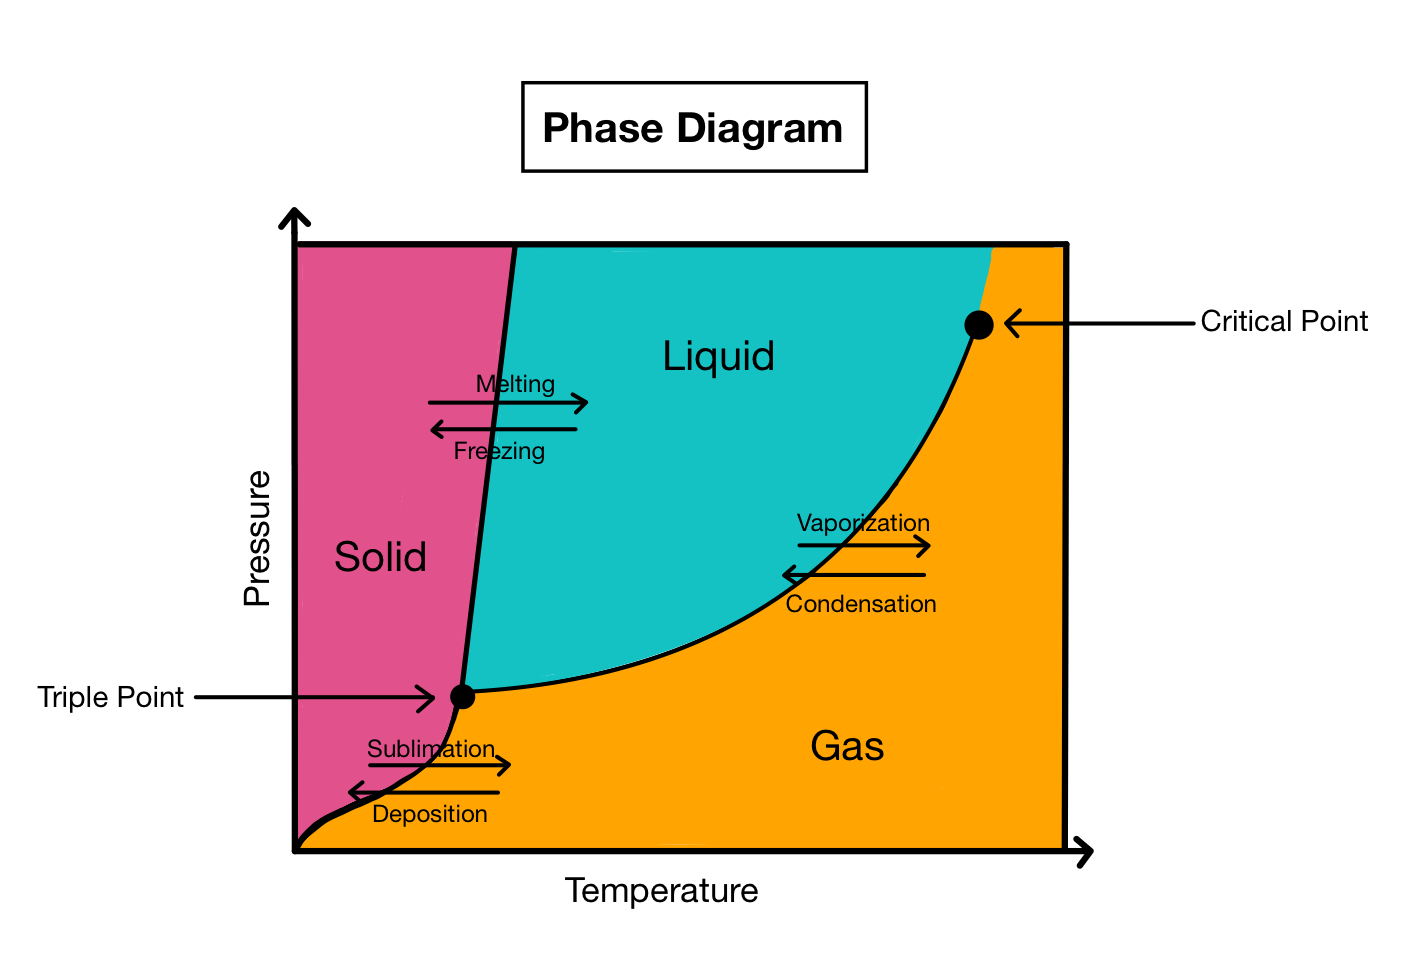
Phase diagrams are graphical representations of the different phases of a substance.
Phase diagrams provide a visual way to understand how a substance behaves under different conditions of temperature and pressure.
Phase diagrams help identify the phase transitions of a substance.
By analyzing a phase diagram, scientists can determine when a substance changes from one phase to another, such as from solid to liquid or liquid to gas.
The three main phases depicted in phase diagrams are solid, liquid, and gas.
These phases are represented by different regions on the diagram, along with the lines that separate them.
Phase diagrams also include other important information, such as the critical point and triple point.
The critical point is the temperature and pressure at which a substance can exist as both a liquid and a gas. The triple point is the unique combination of temperature and pressure where all three phases can coexist in equilibrium.
Phase diagrams can vary depending on the substance being studied.
Different substances have different phase diagrams due to variations in their molecular structures and intermolecular forces.
Phase diagrams can be used to predict phase behavior and phase changes.
By analyzing the phase diagram of a substance, scientists can make predictions about how it will behave under different temperature and pressure conditions.
Phase diagrams are widely used in fields such as chemistry, materials science, and engineering.
They provide valuable information for understanding and designing processes involving phase transformations.
Phase diagrams can help determine the stability of different phases.
By examining the regions on a phase diagram, scientists can determine which phase is the most stable under specific conditions of temperature and pressure.
Phase diagrams can have different shapes, such as triangular, rectangular, or complex.
The shape of a phase diagram depends on the unique characteristics of the substance and the phase transitions it undergoes.
Phase diagrams can exhibit phase boundaries with slopes.
The slopes of these boundaries represent the rate of change of temperature with respect to pressure.
Phase diagrams can also include metastable phases.
Metastable phases are states that are kinetically trapped and exist outside the equilibrium conditions depicted on the phase diagram.
Phase diagrams are essential tools for understanding the behavior and transformations of substances. They provide valuable insights into how different phases interact under varying conditions, allowing scientists and engineers to make predictions and design processes accordingly. Whether it’s determining the stability of phases, predicting phase changes, or analyzing the critical and triple points, phase diagrams play a crucial role in various scientific disciplines. So, next time you come across a phase diagram, remember these 11 intriguing facts about phase diagrams and appreciate the wealth of information they offer.
Conclusion
In conclusion, phase diagrams are fascinating tools that help us understand the behavior of substances under different conditions. They provide valuable insights into the relationships between temperature, pressure, and phase transitions. By studying phase diagrams, scientists can predict the physical state of a substance and tailor its properties for various applications.We have explored 11 intriguing facts about phase diagrams, including their graphical representation, the significance of phase boundaries, and the concept of triple points. We have learned about the different types of phase diagrams and their applications in various fields such as materials science, chemistry, and engineering.Phase diagrams offer a visual representation of how substances transform from one phase to another, providing a roadmap for understanding the complex behavior of matter. By delving deeper into the world of phase diagrams, we gain a better understanding of the properties and interactions of materials, leading to advancements in technology and scientific knowledge.So, the next time you come across a phase diagram, take a moment to appreciate the wealth of information it holds and the incredible insights into the behavior of substances it provides.
FAQs
1. What is a phase diagram?
A phase diagram is a graphical representation that shows the relationships between temperature, pressure, and the different phases of a substance.
2. What are the different phases shown in a phase diagram?
The most common phases shown in a phase diagram include solid, liquid, and gas. However, some phase diagrams may also include additional phases such as plasma or supercritical fluid.
3. What are the main applications of phase diagrams?
Phase diagrams have diverse applications in various fields, including materials science, chemistry, and engineering. They help in understanding and predicting phase transformations, designing materials with specific properties, and optimizing industrial processes.
4. What is a phase boundary?
A phase boundary represents the conditions at which two phases coexist in equilibrium. It separates different regions of the phase diagram and indicates the temperature and pressure at which phase transitions occur.
5. What is a triple point?
A triple point is a specific combination of temperature and pressure at which all three phases (solid, liquid, and gas) of a substance coexist in equilibrium. It represents a unique point on the phase diagram.
6. Can phase diagrams be used to determine the stability of a substance?
Yes, phase diagrams provide information about the stability of different phases of a substance under specific conditions of temperature and pressure. They help identify the phase or phases that are thermodynamically favorable.
7. Can phase diagrams be used for predicting phase transitions?
Yes, phase diagrams are useful for predicting phase transitions. By examining the phase boundaries and their slopes, scientists can determine the conditions required for a substance to undergo a phase transition.
8. Are phase diagrams only applicable to pure substances?
No, phase diagrams can also be applied to mixtures of substances. In such cases, the phase diagram represents the relationship between temperature, pressure, and composition of the mixture.
9. Are phase diagrams static or dynamic?
Phase diagrams are static representations of the behavior of substances under specific conditions. However, they provide valuable insights into the dynamic processes involved in phase transitions.
10. Can phase diagrams be used to determine the conditions necessary for a substance to exist in a specific phase?
Yes, by analyzing the phase diagram, one can determine the temperature and pressure conditions required for a substance to exist in a particular phase.
11. How do phase diagrams contribute to the development of new materials?
Phase diagrams play a crucial role in materials science, enabling scientists to design and develop new materials with specific properties. By understanding the phase behavior of different substances, scientists can manipulate composition and processing conditions to achieve desired material characteristics.
Phase diagrams offer a wealth of information about substance behavior, but there's still more to explore! Delving deeper into the intricacies of these graphical representations can yield even more astounding facts. From the mesmerizing patterns formed by phase boundaries to the mind-boggling complexities of multi-component systems, phase diagrams hold countless secrets waiting to be uncovered. So, if you're ready to expand your knowledge and be amazed by the wonders of phase diagrams, keep reading to discover 18 more captivating facts that will leave you in awe of these essential scientific tools.
Was this page helpful?
Our commitment to delivering trustworthy and engaging content is at the heart of what we do. Each fact on our site is contributed by real users like you, bringing a wealth of diverse insights and information. To ensure the highest standards of accuracy and reliability, our dedicated editors meticulously review each submission. This process guarantees that the facts we share are not only fascinating but also credible. Trust in our commitment to quality and authenticity as you explore and learn with us.