


What is the Smoke Map? The Smoke Map is an online tool that shows real-time data about smoke from wildfires. It helps people see where smoke is coming from and how it spreads. This map uses satellite images and air quality monitors to give accurate information. Knowing where smoke is can help you stay safe and plan outdoor activities. Wildfires can affect air quality, making it hard to breathe, especially for those with asthma or other lung issues. By checking the Smoke Map, you can avoid smoky areas and protect your health. Stay informed and breathe easier with this handy tool.
What is the Smoke Map?
The Smoke Map is a tool that helps track and visualize smoke from wildfires. It provides real-time data on smoke distribution, air quality, and potential health impacts. Here are some fascinating facts about the Smoke Map.
-
Developed by NASA and NOAA: The Smoke Map is a collaborative effort between NASA and the National Oceanic and Atmospheric Administration (NOAA). These organizations use satellite data to monitor smoke and air quality.
-
Real-time Updates: The map updates in real-time, providing the latest information on smoke distribution. This helps people stay informed about air quality in their area.
-
Air Quality Index (AQI): The Smoke Map uses the Air Quality Index to indicate the level of pollution. AQI values range from 0 to 500, with higher values indicating worse air quality.
-
Health Recommendations: Based on AQI levels, the map provides health recommendations. For example, it advises sensitive groups to avoid outdoor activities when air quality is poor.
-
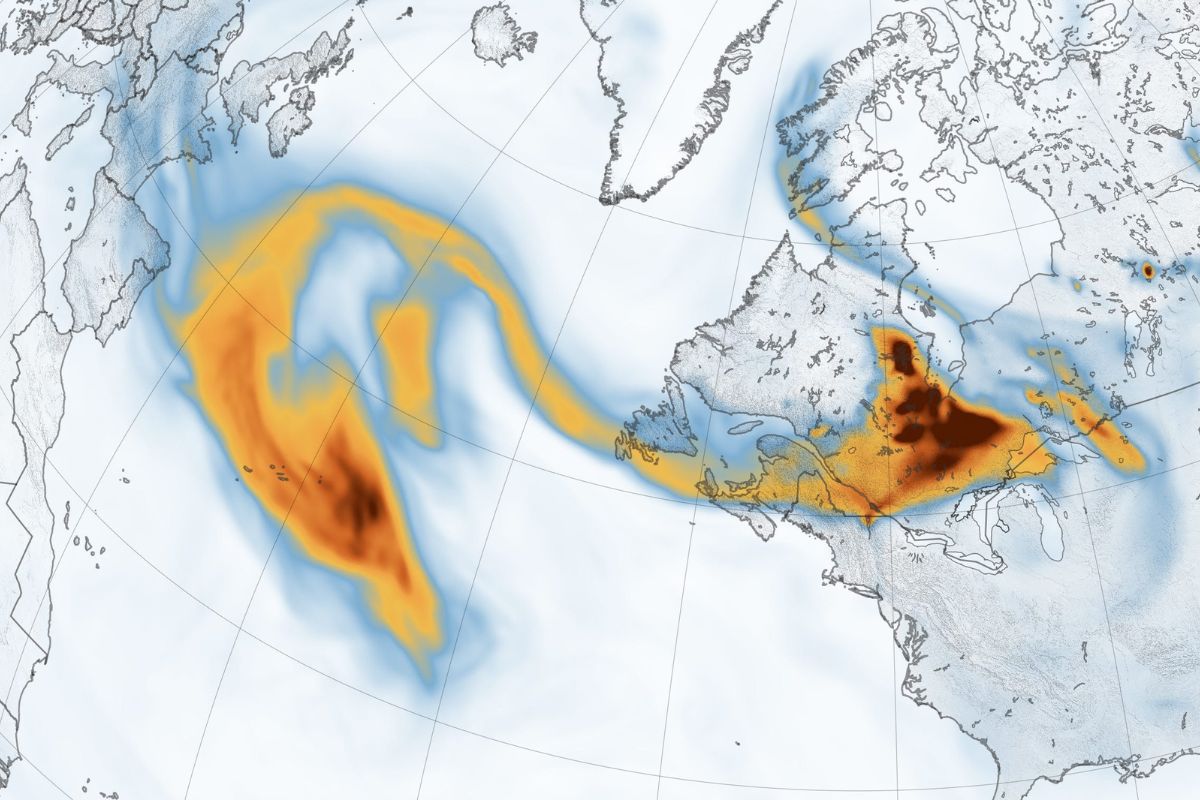
Satellite Imagery: The map relies on satellite imagery to detect smoke plumes. These images are captured by satellites orbiting the Earth.
How the Smoke Map Works
Understanding how the Smoke Map functions can help users make the most of its features. Here are some key points about its operation.
-
Data Collection: Satellites collect data on smoke and air quality. This data is then processed and displayed on the map.
-
Smoke Plume Detection: The map uses algorithms to detect smoke plumes from satellite images. These plumes are then overlaid on the map.
-
Color Coding: Different colors represent different AQI levels. Green indicates good air quality, while red indicates hazardous conditions.
-
Interactive Features: Users can zoom in and out, and click on specific areas for detailed information. This makes it easy to find relevant data.
-
Historical Data: The map also provides historical data, allowing users to see how smoke and air quality have changed over time.
Benefits of the Smoke Map
The Smoke Map offers numerous benefits to individuals and communities. Here are some of the most significant advantages.
-
Public Health: By providing real-time air quality data, the map helps protect public health. People can take precautions to avoid exposure to harmful smoke.
-
Emergency Response: Emergency responders use the map to plan and execute firefighting efforts. It helps them understand the spread of smoke and prioritize resources.
-
Environmental Monitoring: The map aids in monitoring environmental conditions. Researchers use it to study the impact of wildfires on air quality and climate.
-
Travel Planning: Travelers can use the map to plan their routes and avoid areas with poor air quality. This is especially useful for outdoor activities.
-
Educational Tool: Schools and educational institutions use the map to teach students about air quality and environmental science.
Interesting Facts about Smoke and Air Quality
Smoke and air quality are complex topics with many interesting aspects. Here are some lesser-known facts.
-
Particulate Matter: Smoke contains tiny particles called particulate matter (PM). PM2.5, particles smaller than 2.5 micrometers, can penetrate deep into the lungs and cause health problems.
-
Wildfire Seasons: Wildfire seasons vary by region. In the western United States, wildfire season typically peaks in late summer and early fall.
-
Health Effects: Exposure to smoke can cause respiratory issues, eye irritation, and cardiovascular problems. Long-term exposure can lead to chronic health conditions.
-
Climate Change: Climate change is increasing the frequency and intensity of wildfires. This leads to more smoke and poorer air quality.
-
Global Impact: Smoke from large wildfires can travel thousands of miles. For example, smoke from wildfires in California has been detected on the East Coast of the United States.
How to Use the Smoke Map
Knowing how to use the Smoke Map effectively can enhance its benefits. Here are some tips for getting the most out of the map.
-
Check Daily: Make it a habit to check the map daily, especially during wildfire season. This helps you stay informed about air quality in your area.
-
Follow Recommendations: Pay attention to health recommendations based on AQI levels. Avoid outdoor activities when air quality is poor.
-
Stay Informed: Use the map in conjunction with other sources of information, such as local news and weather reports. This provides a comprehensive view of air quality conditions.
-
Share Information: Share the map and its data with friends and family. This helps others stay informed and take necessary precautions.
-
Provide Feedback: If you notice any issues or inaccuracies with the map, provide feedback to the developers. This helps improve the tool for everyone.
Final Thoughts on the Smoke Map
The Smoke Map is a powerful tool for understanding air quality and its impact on our daily lives. It provides real-time data on wildfire smoke and air pollution, helping people make informed decisions about their health and safety. By using this map, you can avoid areas with poor air quality, protect your respiratory health, and plan outdoor activities more effectively.
Wildfires are becoming more frequent and intense, making tools like the Smoke Map essential. It’s not just for those living near fire-prone areas; smoke can travel hundreds of miles, affecting air quality far from the source.
Stay informed, stay safe, and use the Smoke Map to keep track of air quality in your area. It’s a small step that can make a big difference in your health and well-being.
Was this page helpful?
Our commitment to delivering trustworthy and engaging content is at the heart of what we do. Each fact on our site is contributed by real users like you, bringing a wealth of diverse insights and information. To ensure the highest standards of accuracy and reliability, our dedicated editors meticulously review each submission. This process guarantees that the facts we share are not only fascinating but also credible. Trust in our commitment to quality and authenticity as you explore and learn with us.