


What is a Fishbone Diagram? A Fishbone diagram, also known as an Ishikawa diagram or cause-and-effect diagram, is a visual tool used to identify, explore, and display the possible causes of a specific problem or effect. Named for its fish-like shape, this diagram helps teams brainstorm and categorize potential sources of issues in a structured manner. By organizing causes into major categories such as people, processes, materials, and environment, it simplifies complex problems, making them easier to understand and address. Whether you're tackling quality control issues in manufacturing or troubleshooting software bugs, a Fishbone diagram can be a game-changer in pinpointing root causes and finding effective solutions.
What is a Fishbone Diagram?
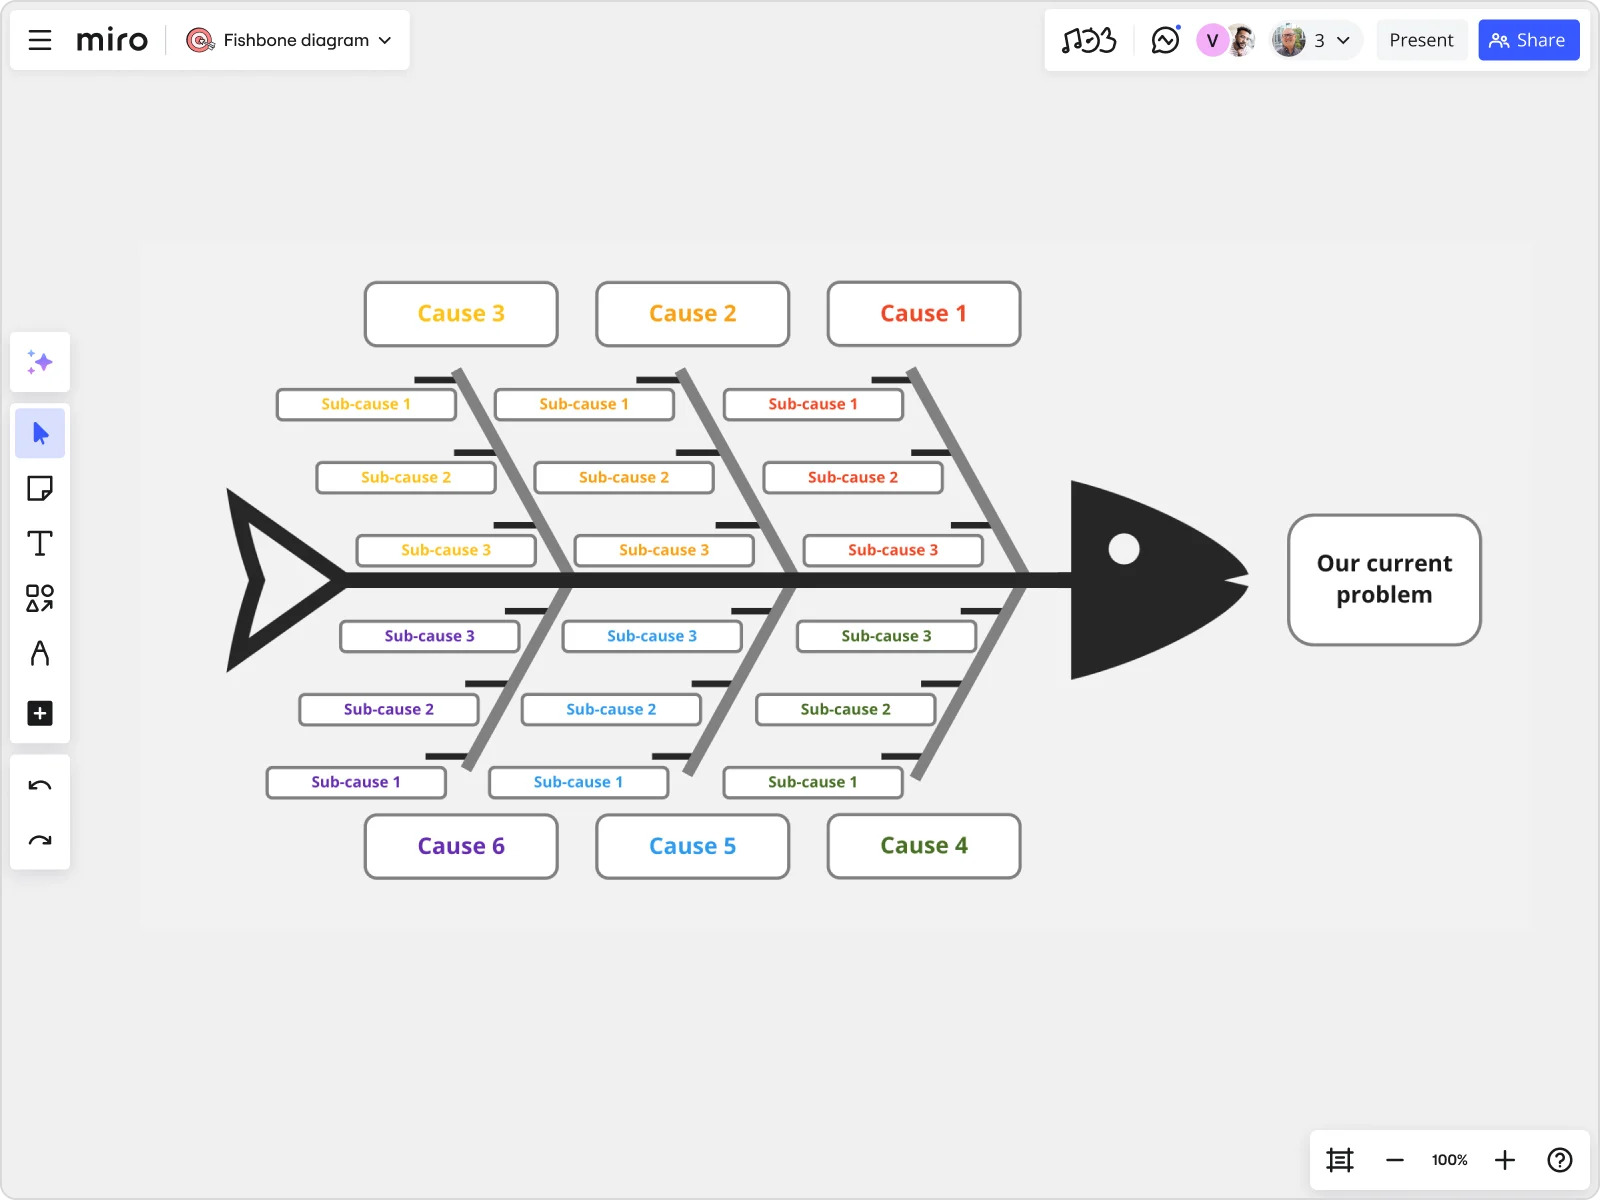
A Fishbone Diagram, also known as an Ishikawa diagram or cause-and-effect diagram, is a visual tool used to identify the root causes of a problem. It resembles a fish skeleton, with the problem at the head and potential causes branching off the spine.
- The Fishbone Diagram was created by Kaoru Ishikawa, a Japanese quality control expert, in 1968.
- It is widely used in various industries, including manufacturing, healthcare, and business management.
- The diagram helps teams systematically explore all potential causes of a problem, promoting thorough analysis.
- It is often used in conjunction with the "5 Whys" technique to drill down to the root cause.
- The diagram is particularly useful in quality control processes to identify defects and areas for improvement.
Structure of a Fishbone Diagram
Understanding the structure of a Fishbone Diagram is crucial for effectively using it to solve problems. The diagram typically consists of a central "spine" with branches representing different categories of potential causes.
- The main "spine" represents the problem or effect being analyzed.
- Major branches, or "bones," extend from the spine, each representing a category of potential causes.
- Common categories include People, Methods, Machines, Materials, Measurements, and Environment.
- Sub-branches break down each major category into more specific causes.
- The diagram encourages brainstorming and collaboration, making it easier to identify all possible factors contributing to the problem.
Benefits of Using a Fishbone Diagram
The Fishbone Diagram offers several advantages that make it a popular choice for problem-solving and quality control.
- It provides a clear visual representation of complex problems and their potential causes.
- The diagram helps teams organize their thoughts and systematically explore all possible causes.
- It encourages collaboration and input from all team members, leading to more comprehensive analysis.
- The Fishbone Diagram can be used in various stages of problem-solving, from initial brainstorming to final analysis.
- It helps identify not only the root cause but also contributing factors that may need to be addressed.
How to Create a Fishbone Diagram
Creating a Fishbone Diagram involves several steps, from defining the problem to brainstorming potential causes and organizing them into categories.
- Start by clearly defining the problem or effect you want to analyze.
- Draw a horizontal line (the "spine") and write the problem at the end.
- Identify major categories of potential causes and draw branches extending from the spine.
- Brainstorm specific causes within each category and add them as sub-branches.
- Review the diagram with the team to ensure all potential causes have been considered.
Applications of Fishbone Diagrams
Fishbone Diagrams are versatile tools that can be applied in various contexts to identify and address problems.
- In manufacturing, they are used to identify causes of defects and improve product quality.
- Healthcare professionals use them to analyze medical errors and improve patient safety.
- Business managers use Fishbone Diagrams to identify bottlenecks and inefficiencies in processes.
- They are also used in education to analyze student performance and identify areas for improvement.
- Fishbone Diagrams can be used in project management to identify risks and potential issues before they arise.
Common Challenges and Solutions
While Fishbone Diagrams are powerful tools, they can present some challenges. Understanding these challenges and how to address them can improve their effectiveness.
- One common challenge is identifying all relevant categories and causes. Involving a diverse team can help ensure comprehensive analysis.
- Another challenge is keeping the diagram manageable and not overly complex. Focus on the most significant causes to avoid clutter.
- Ensuring team members understand how to use the diagram effectively can be a challenge. Providing training and examples can help.
- It can be difficult to prioritize causes once they are identified. Using additional tools like the Pareto Principle can help focus on the most impactful causes.
- Maintaining the diagram as a living document that evolves with new information can be challenging. Regular reviews and updates can keep it relevant.
Real-World Examples of Fishbone Diagrams
Seeing how Fishbone Diagrams are used in real-world scenarios can provide valuable insights and inspiration for their application.
- Toyota, a pioneer in quality control, uses Fishbone Diagrams to identify and address production issues.
- Hospitals use them to analyze patient care processes and reduce the incidence of medical errors.
- Software development teams use Fishbone Diagrams to identify root causes of bugs and improve code quality.
- Educational institutions use them to analyze factors affecting student performance and develop improvement strategies.
- Retail businesses use Fishbone Diagrams to identify causes of customer dissatisfaction and improve service quality.
Tips for Effective Use of Fishbone Diagrams
To get the most out of Fishbone Diagrams, consider these tips for effective use.
- Involve a diverse team to ensure all perspectives are considered.
- Use the "5 Whys" technique to drill down to the root cause of each identified issue.
- Regularly review and update the diagram as new information becomes available.
The Final Word on Fishbone Diagrams
Fishbone diagrams, also known as Ishikawa diagrams, are powerful tools for identifying root causes of problems. They help teams brainstorm and categorize potential causes, making it easier to pinpoint the exact issue. These diagrams are especially useful in quality management and process improvement.
Creating a fishbone diagram involves defining the problem, identifying major categories of causes, and brainstorming possible causes within each category. This structured approach ensures that all potential factors are considered.
Whether you're tackling a business challenge or a personal project, fishbone diagrams can provide clarity and direction. They encourage collaboration and critical thinking, leading to more effective problem-solving.
So next time you face a complex issue, grab a pen and paper, and start sketching out a fishbone diagram. You might be surprised at how quickly you can identify the root cause and find a solution.
Was this page helpful?
Our commitment to delivering trustworthy and engaging content is at the heart of what we do. Each fact on our site is contributed by real users like you, bringing a wealth of diverse insights and information. To ensure the highest standards of accuracy and reliability, our dedicated editors meticulously review each submission. This process guarantees that the facts we share are not only fascinating but also credible. Trust in our commitment to quality and authenticity as you explore and learn with us.