
Ever wondered how to pinpoint the root cause of a problem? The Ishikawa diagram, also known as the Fishbone diagram or Cause and Effect diagram, is a powerful tool for this. Created by Kaoru Ishikawa in the 1960s, it helps teams identify, explore, and display possible causes of a specific issue. This visual tool resembles a fish skeleton, with the problem at the head and causes branching off like bones. It's widely used in quality control and project management to systematically break down complex problems. Ready to dive into 31 intriguing facts about the Ishikawa diagram? Let's get started!
What is an Ishikawa Diagram?
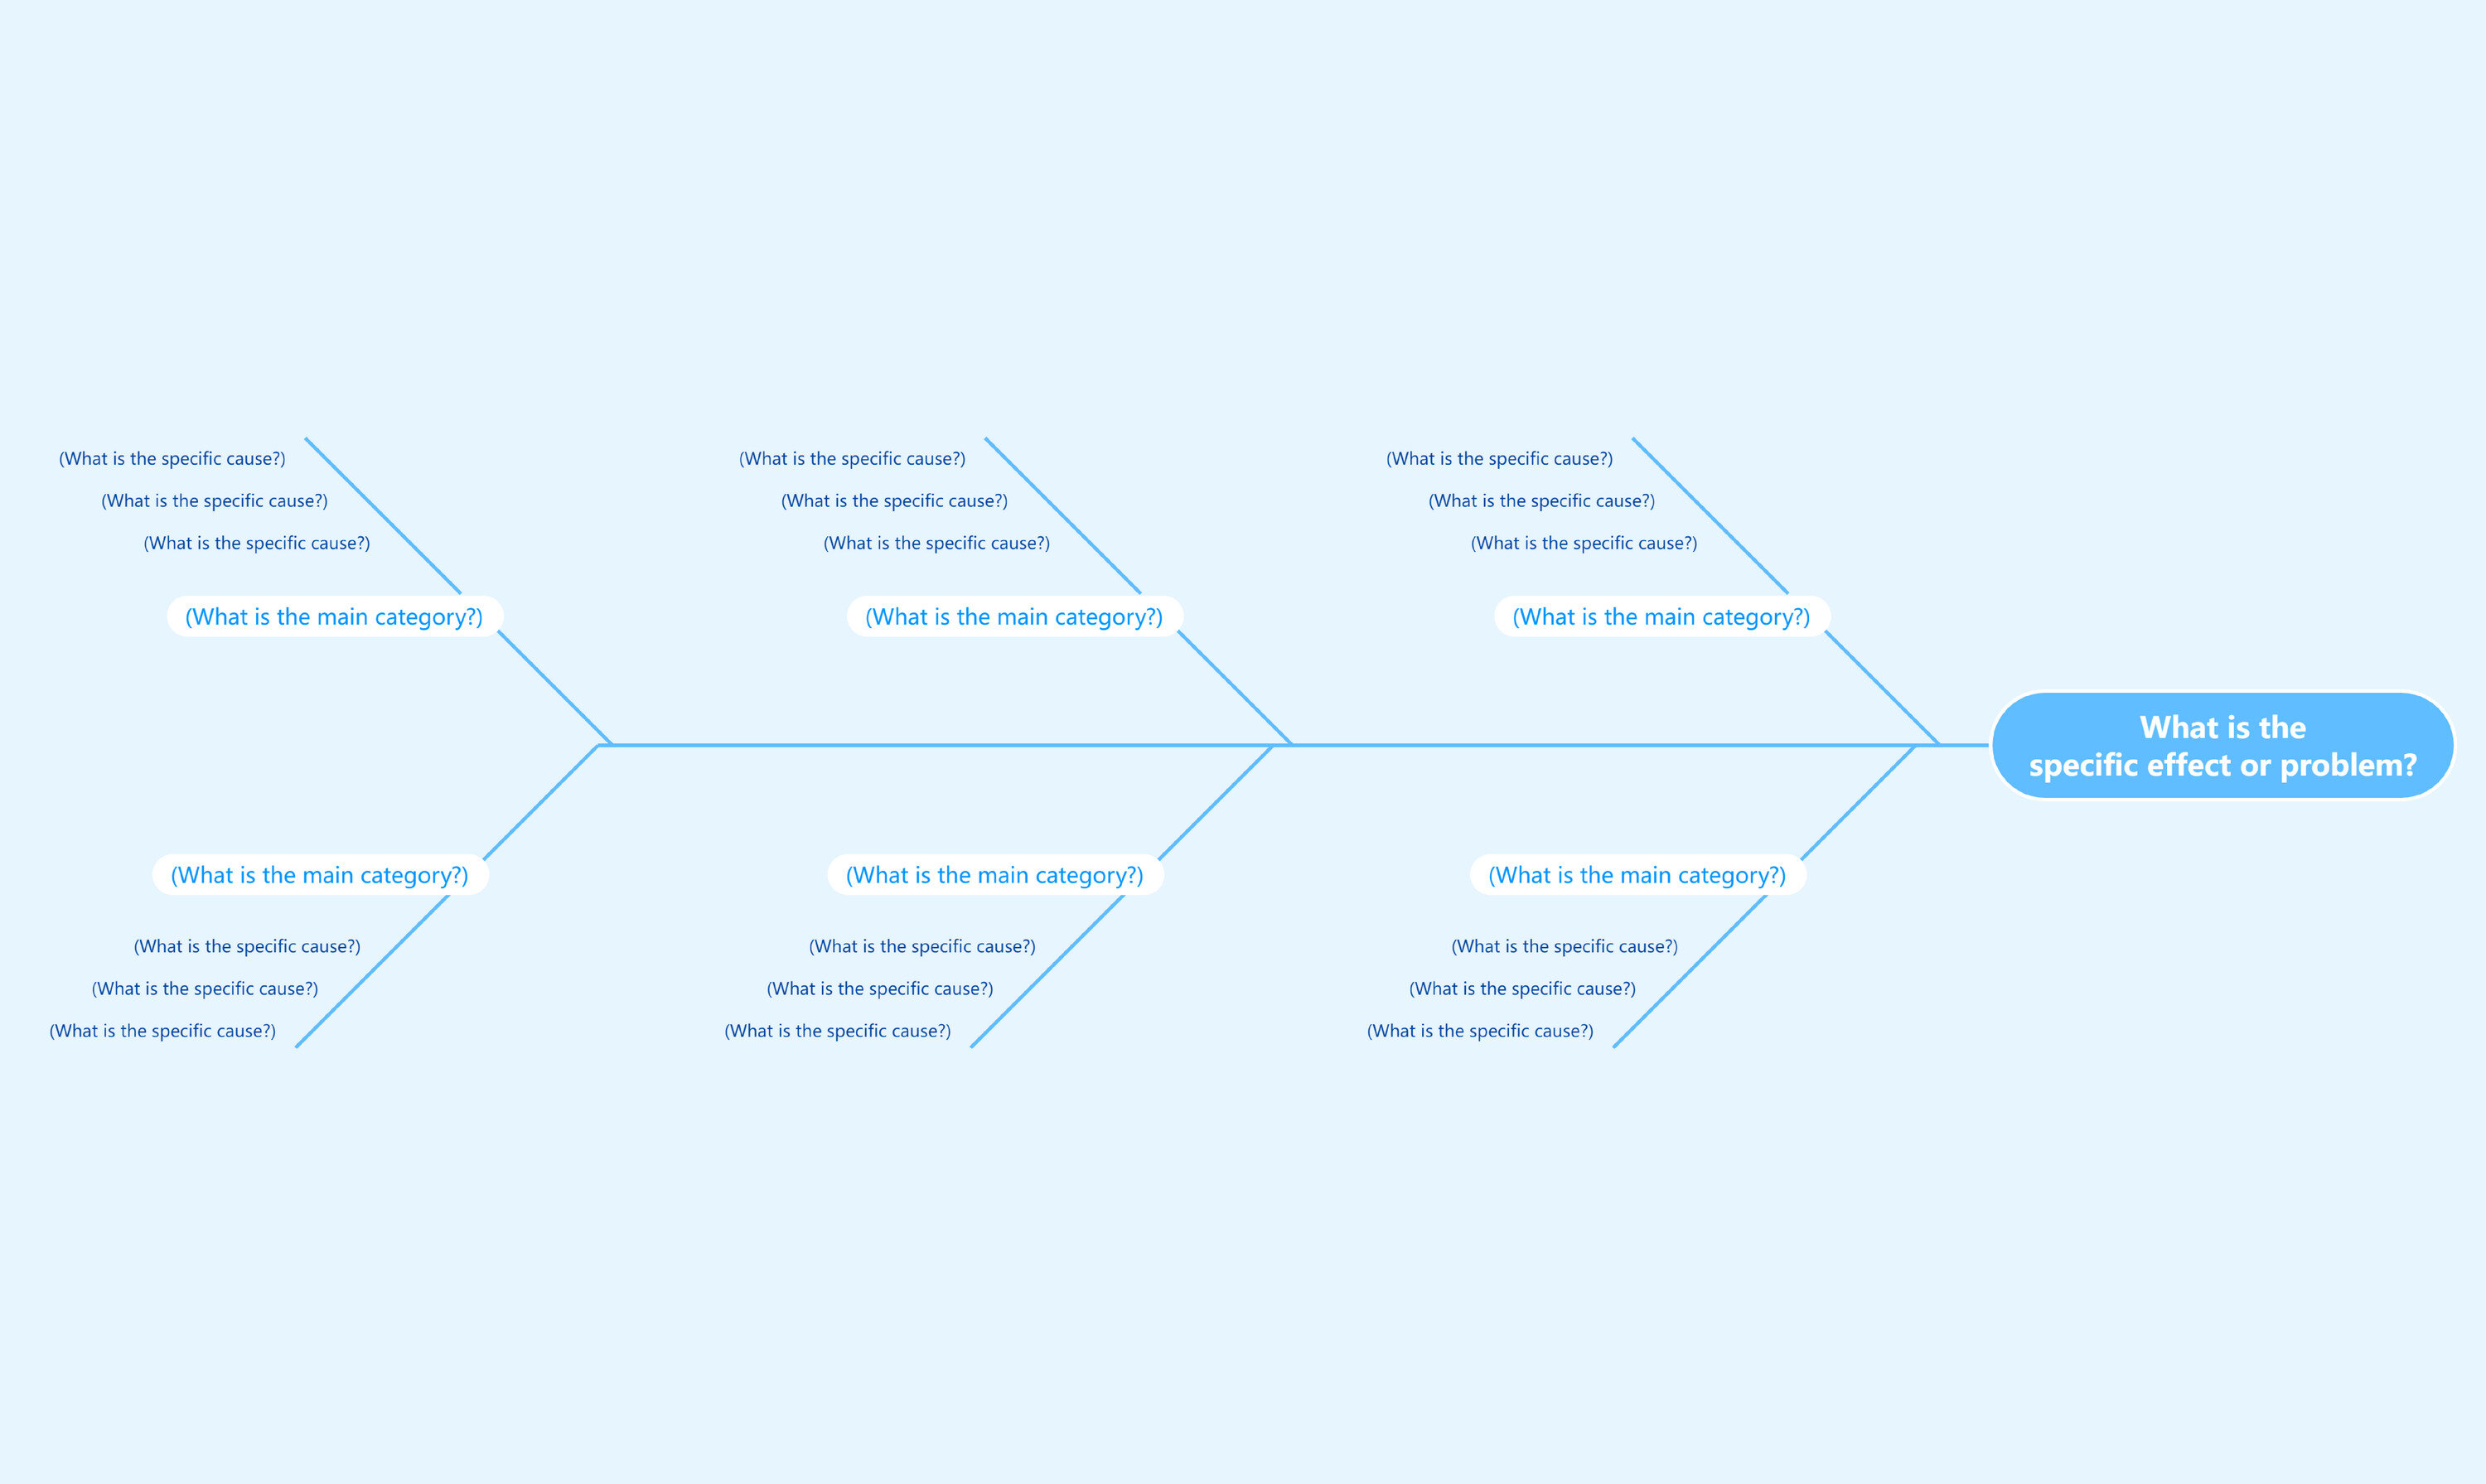
An Ishikawa diagram, also known as a fishbone diagram or cause-and-effect diagram, is a tool used to identify potential causes of a problem. It helps teams brainstorm and categorize ideas to find the root cause of an issue.
- The Ishikawa diagram was created by Kaoru Ishikawa, a Japanese organizational theorist, in the 1960s.
- It's called a fishbone diagram because its shape resembles a fish skeleton, with the problem at the head and causes branching off like bones.
- This tool is widely used in quality control and process improvement to systematically identify potential factors causing an overall effect.
- The diagram helps teams visualize the relationship between different causes and their impact on the problem.
- It is often used in manufacturing, healthcare, education, and service industries to solve complex issues.
How to Create an Ishikawa Diagram
Creating an Ishikawa diagram involves several steps. Here’s a simple guide to get started.
- Define the problem: Clearly state the issue you want to analyze. This becomes the "head" of the fish.
- Identify major categories: Common categories include People, Methods, Machines, Materials, Measurements, and Environment.
- Brainstorm potential causes: For each category, brainstorm possible causes of the problem and add them as branches.
- Analyze the diagram: Look for patterns or repeated causes to identify the root cause.
- Prioritize causes: Determine which causes are most likely to be the root of the problem and focus on those.
Benefits of Using an Ishikawa Diagram
The Ishikawa diagram offers several advantages for problem-solving and process improvement.
- It encourages team collaboration by involving multiple perspectives in identifying causes.
- The diagram provides a visual representation of complex problems, making it easier to understand.
- It helps in organizing thoughts and ideas systematically.
- The tool can be used to identify gaps in knowledge or processes.
- It promotes a structured approach to problem-solving, reducing the likelihood of overlooking potential causes.
Common Categories in an Ishikawa Diagram
Understanding the common categories used in an Ishikawa diagram can help in organizing potential causes effectively.
- People: Factors related to human resources, such as skills, training, and communication.
- Methods: Processes or procedures that might contribute to the problem.
- Machines: Equipment or technology-related issues.
- Materials: Raw materials or supplies that could affect the outcome.
- Measurements: Data collection and measurement techniques.
- Environment: External factors like weather, regulations, or market conditions.
Real-World Applications of Ishikawa Diagrams
Ishikawa diagrams are used in various industries to solve real-world problems.
- In manufacturing, they help identify causes of defects or production delays.
- Healthcare professionals use them to analyze medical errors or patient safety issues.
- Education systems apply them to improve teaching methods and student performance.
- Service industries utilize them to enhance customer satisfaction and service quality.
- Software development teams use them to debug and improve software performance.
Tips for Effective Use of Ishikawa Diagrams
Maximize the effectiveness of your Ishikawa diagram with these tips.
- Involve a diverse team: Include members from different departments to get a comprehensive view.
- Be specific: Clearly define each cause to avoid ambiguity.
- Use data: Support your causes with data and evidence whenever possible.
- Review and revise: Regularly update the diagram as new information becomes available.
- Facilitate open discussion: Encourage team members to share their insights and ideas freely.
The Final Word on Ishikawa Diagrams
Ishikawa diagrams, also known as fishbone diagrams, are powerful tools for identifying root causes of problems. They help teams visually break down issues into manageable parts, making it easier to pinpoint where things go wrong. By organizing potential causes into categories like people, processes, materials, and machinery, these diagrams provide a structured approach to problem-solving.
Using Ishikawa diagrams can lead to more effective solutions and prevent recurring issues. They encourage collaboration, ensuring all team members contribute their insights. This collective effort often uncovers hidden factors that might otherwise be overlooked.
Whether you're in manufacturing, healthcare, or any other field, incorporating Ishikawa diagrams into your problem-solving toolkit can make a significant difference. They simplify complex issues, promote teamwork, and ultimately lead to better outcomes. So next time you're faced with a challenge, grab a pen and start sketching your fishbone diagram. You'll be glad you did.
Was this page helpful?
Our commitment to delivering trustworthy and engaging content is at the heart of what we do. Each fact on our site is contributed by real users like you, bringing a wealth of diverse insights and information. To ensure the highest standards of accuracy and reliability, our dedicated editors meticulously review each submission. This process guarantees that the facts we share are not only fascinating but also credible. Trust in our commitment to quality and authenticity as you explore and learn with us.