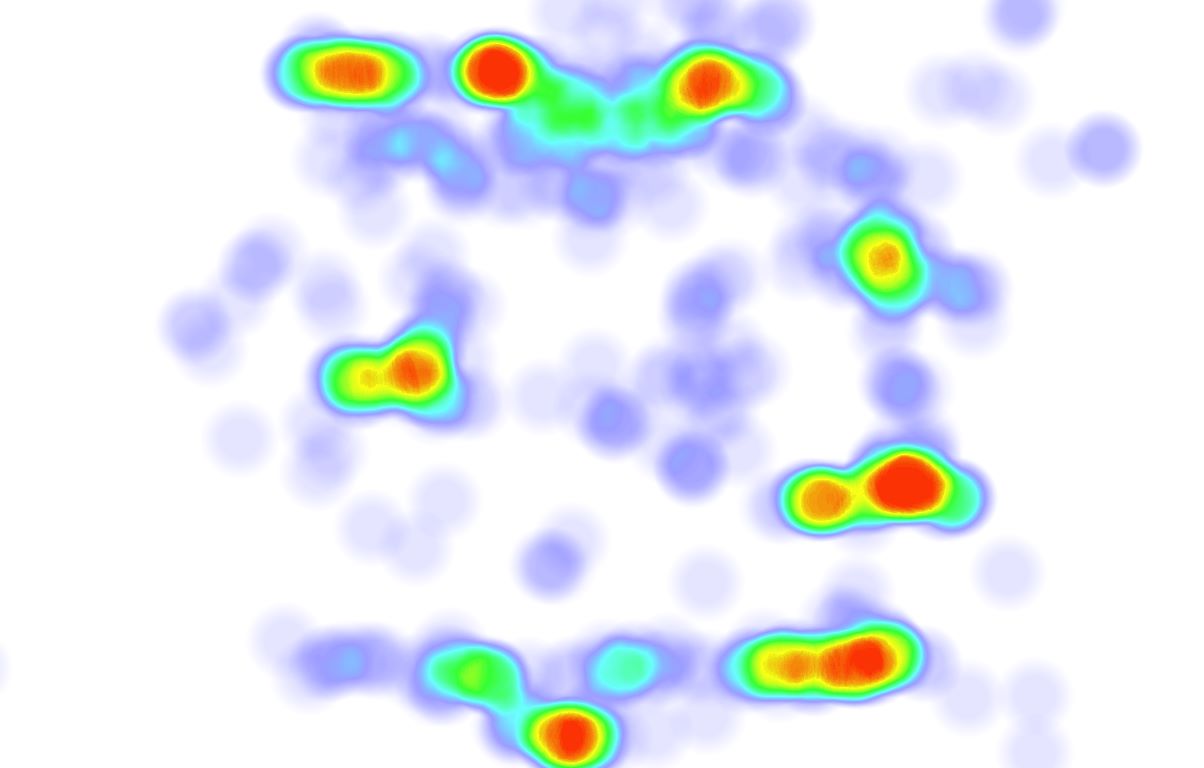
Heatmaps are powerful tools for visualizing data, showing how users interact with websites or apps. They use color gradients to represent data density, making it easy to spot trends and patterns. Heatmaps can reveal which parts of a webpage get the most attention, helping improve design and user experience. They come in various types, like scroll maps, click maps, and hover maps, each offering unique insights. Businesses use them to optimize layouts, increase engagement, and boost conversions. Understanding heatmaps can transform how you approach digital strategies, making them an essential tool in any marketer's toolkit. Ready to learn more? Let's dive into 29 fascinating facts about heatmaps!
Key Takeaways:
- Heatmaps are colorful data visualizations that help us understand patterns and trends. They're used in web analytics, healthcare, sports, and more, making data easier to interpret and improving user experiences.
- While heatmaps offer many benefits, they also come with challenges like data overload and privacy concerns. The future of heatmaps looks promising with advancements in technology, including AI integration and 3D visualizations.
What Are Heatmaps?
Heatmaps are visual representations of data where values are depicted by color. They help in understanding complex data sets by showing patterns, trends, and anomalies. Here are some intriguing facts about heatmaps:
-
Origins: The concept of heatmaps dates back to the 19th century when Toussaint Loua used shading to visualize social statistics.
-
Color Coding: Colors in heatmaps usually range from cool (blue) to warm (red) tones, indicating low to high values respectively.
-
Types: There are various types of heatmaps, including geographical, webpage, and correlation heatmaps.
-
Web Analytics: In web analytics, heatmaps show where users click, scroll, and hover on a webpage.
-
Eye-Tracking: Eye-tracking heatmaps reveal where users' eyes focus the most on a screen.
How Heatmaps Work
Heatmaps function by collecting data points and translating them into color gradients. This process makes it easier to identify areas of interest or concern.
-
Data Collection: Data for heatmaps can be collected through various means like user interactions, sensors, or surveys.
-
Color Gradients: The intensity of color in a heatmap represents the frequency or magnitude of data points.
-
Real-Time Updates: Some heatmaps can update in real-time, providing immediate insights.
-
Software Tools: Tools like Google Analytics, Crazy Egg, and Hotjar are popular for creating heatmaps.
-
Customization: Heatmaps can be customized to show different data layers, making them versatile for various applications.
Applications of Heatmaps
Heatmaps have a wide range of applications across different fields, from business to healthcare.
-
Marketing: Marketers use heatmaps to understand user behavior on websites, optimizing layouts for better engagement.
-
Healthcare: In healthcare, heatmaps help in visualizing patient data, such as the spread of diseases.
-
Sports: Coaches use heatmaps to analyze players' movements and strategies during games.
-
Education: Educators employ heatmaps to track student performance and engagement in online courses.
-
Retail: Retailers use heatmaps to study customer movement within stores, improving product placement.
Benefits of Using Heatmaps
Heatmaps offer several advantages that make them indispensable tools for data analysis.
-
Easy Interpretation: Heatmaps simplify complex data, making it easier to understand at a glance.
-
Identifying Trends: They help in spotting trends and patterns that might be missed in raw data.
-
Improving UX: By showing user interactions, heatmaps assist in enhancing user experience on websites.
-
Resource Allocation: Businesses can allocate resources more effectively by identifying high-traffic areas.
-
Problem Solving: Heatmaps can highlight problem areas, aiding in quicker resolution.
Challenges and Limitations
Despite their usefulness, heatmaps come with certain challenges and limitations.
-
Data Overload: Too much data can make heatmaps cluttered and hard to read.
-
Misinterpretation: Incorrect interpretation of colors can lead to wrong conclusions.
-
Privacy Concerns: Collecting user data for heatmaps can raise privacy issues.
-
Technical Skills: Creating and analyzing heatmaps require a certain level of technical expertise.
-
Cost: Some advanced heatmapping tools can be expensive, limiting accessibility for smaller businesses.
Future of Heatmaps
The future of heatmaps looks promising with advancements in technology and data analytics.
-
AI Integration: Artificial intelligence can enhance heatmap accuracy and provide deeper insights.
-
3D Heatmaps: Emerging technologies are making 3D heatmaps possible, offering more detailed visualizations.
-
Mobile Optimization: With the rise of mobile usage, heatmaps are being optimized for mobile interfaces.
-
Predictive Analytics: Future heatmaps may incorporate predictive analytics, forecasting trends and behaviors.
Final Thoughts on Heatmaps
Heatmaps offer a powerful way to visualize data, making complex information easy to understand. They help identify patterns, trends, and areas needing improvement. Whether used in website analytics, scientific research, or business strategy, heatmaps provide valuable insights that can drive better decisions.
Understanding how to read and interpret these visual tools can give you a competitive edge. They highlight user behavior, showing where people click, scroll, or spend the most time. This information can guide design changes, marketing strategies, and content placement.
Incorporating heatmaps into your analysis toolkit can transform how you approach data. They simplify the process of identifying what works and what doesn't, saving time and resources. So, next time you're faced with a sea of numbers, consider using a heatmap to bring clarity and focus to your data-driven decisions.
Frequently Asked Questions
Was this page helpful?
Our commitment to delivering trustworthy and engaging content is at the heart of what we do. Each fact on our site is contributed by real users like you, bringing a wealth of diverse insights and information. To ensure the highest standards of accuracy and reliability, our dedicated editors meticulously review each submission. This process guarantees that the facts we share are not only fascinating but also credible. Trust in our commitment to quality and authenticity as you explore and learn with us.


