
Bimodal distribution might sound like a complex term, but it’s simpler than you think. Imagine a graph with two distinct peaks. That’s bimodal! This type of distribution shows up in various fields like biology, economics, and even daily life. For example, consider the heights of adults in a mixed-gender group. You’ll often see two peaks: one for men and one for women. Understanding bimodal distribution helps in identifying patterns and making informed decisions. Whether you’re a student, researcher, or just curious, knowing these 26 facts will give you a solid grasp of this fascinating concept. Ready to dive in? Let’s get started!
What is Bimodal?
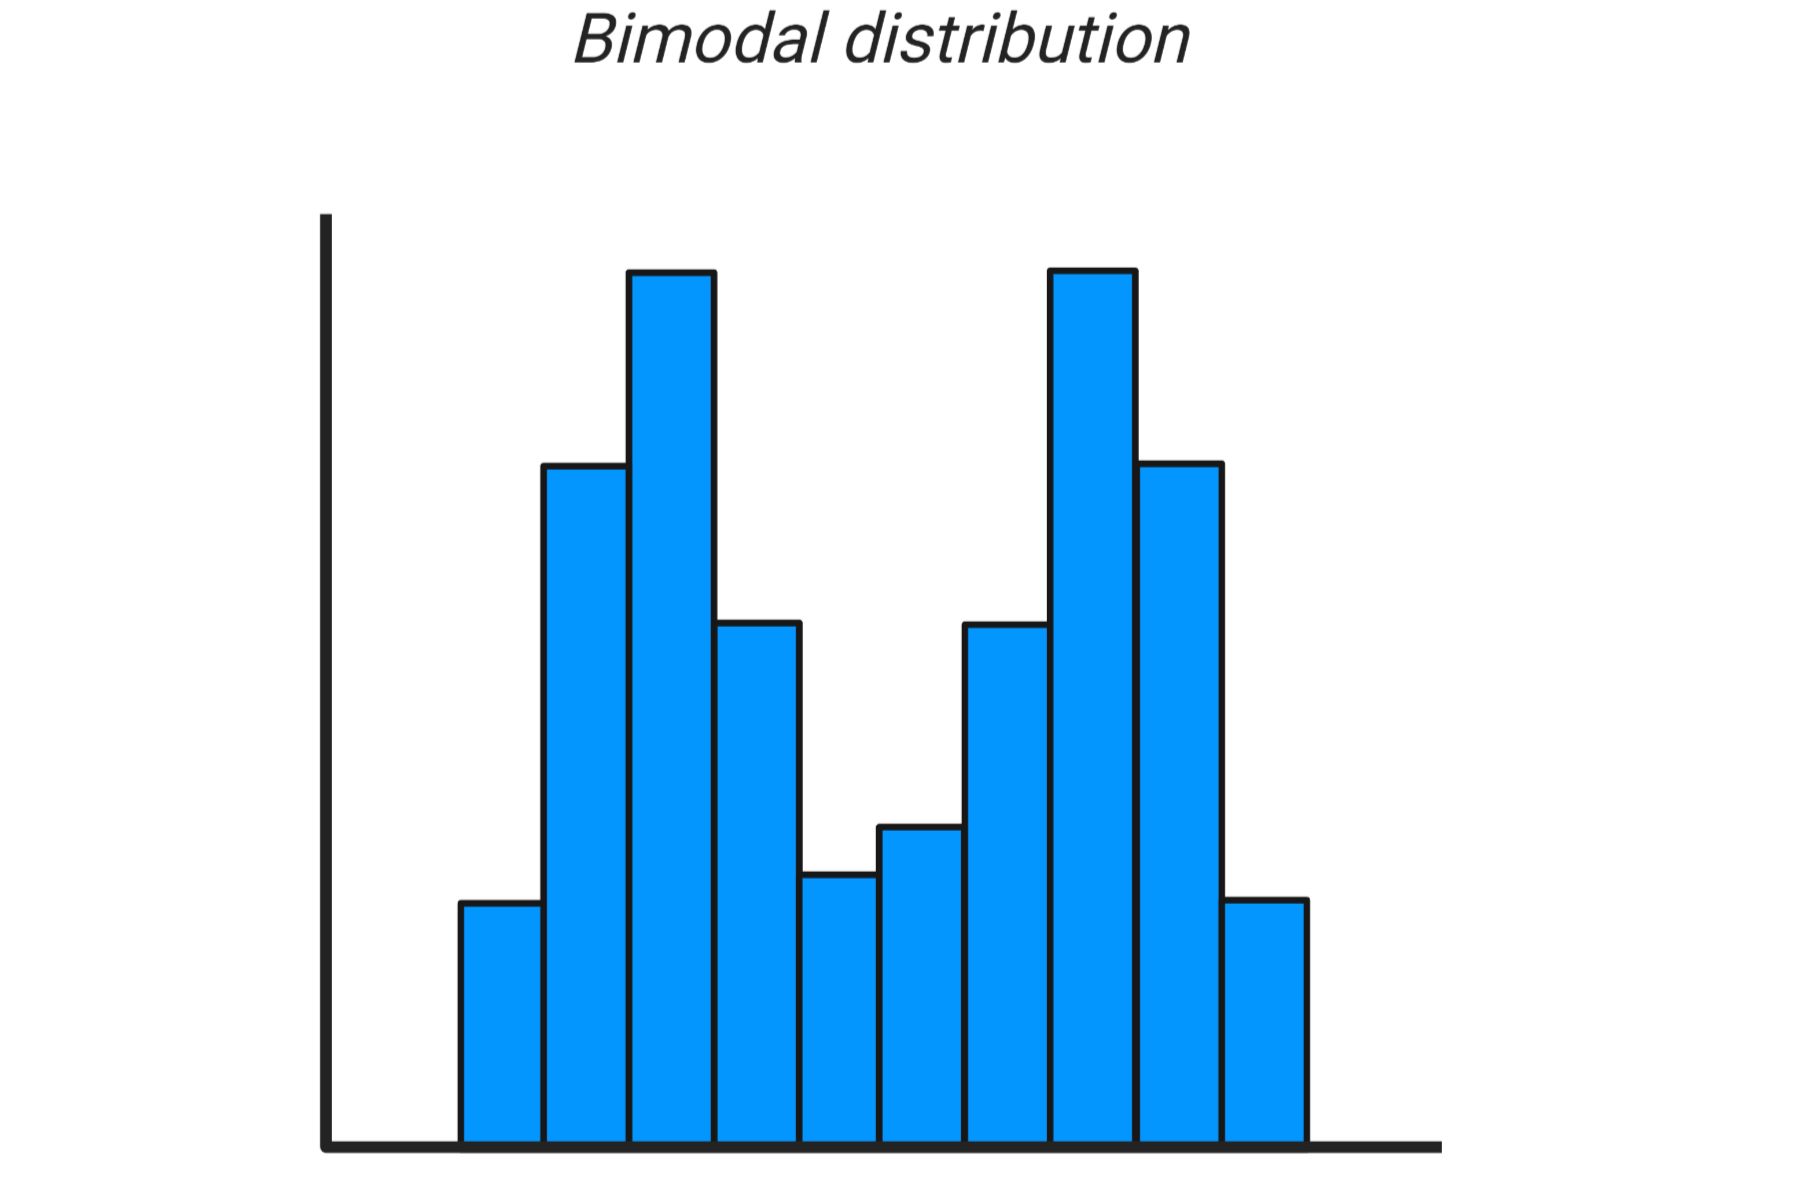
Bimodal distribution is a statistical term that describes a set of data with two different peaks or modes. These peaks represent the most frequently occurring values in the dataset. Understanding bimodal distributions can offer insights into various phenomena.
-
Two Peaks: Bimodal distributions have two distinct peaks, indicating two different modes or most frequent values.
-
Real-World Examples: Examples include heights of adults (separated by gender) and daily temperatures (summer vs. winter).
-
Not Always Symmetrical: Bimodal distributions can be asymmetrical, with one peak higher than the other.
Characteristics of Bimodal Distributions
Bimodal distributions have unique characteristics that set them apart from other types of distributions. These features can help identify and analyze bimodal data effectively.
-
Two Modes: The defining feature is the presence of two modes or peaks.
-
Gap Between Peaks: Often, there is a noticeable gap between the two peaks.
-
Different Shapes: Peaks can be sharp or flat, depending on the data.
Applications of Bimodal Distributions
Bimodal distributions are not just theoretical concepts; they have practical applications in various fields. Understanding these applications can help in better data analysis and decision-making.
-
Market Research: Used to identify different customer segments.
-
Medicine: Helps in understanding the distribution of certain health metrics across different populations.
-
Education: Analyzes test scores to identify different groups of students.
Identifying Bimodal Distributions
Identifying bimodal distributions requires specific techniques and tools. Knowing how to spot these distributions can make data analysis more accurate.
-
Histograms: A common tool for visualizing bimodal distributions.
-
Kernel Density Estimation: A statistical method to estimate the probability density function of a random variable.
-
Box Plots: Can sometimes reveal bimodal characteristics.
Challenges in Analyzing Bimodal Distributions
Analyzing bimodal distributions comes with its own set of challenges. Being aware of these challenges can help in better data interpretation.
-
Misidentification: Sometimes, data may appear bimodal but is not.
-
Complex Analysis: Requires more sophisticated statistical techniques.
-
Data Quality: Poor quality data can obscure bimodal patterns.
Bimodal vs. Unimodal Distributions
Understanding the difference between bimodal and unimodal distributions is crucial for accurate data analysis. This section highlights the key differences.
-
Number of Peaks: Unimodal has one peak, while bimodal has two.
-
Data Interpretation: Bimodal distributions often indicate the presence of two different groups within the data.
-
Statistical Techniques: Different techniques are used to analyze unimodal and bimodal distributions.
Examples of Bimodal Distributions in Nature
Nature provides numerous examples of bimodal distributions. These examples help in understanding how bimodal distributions occur naturally.
-
Animal Sizes: Different species within the same genus can show bimodal size distributions.
-
Plant Heights: Some plant species exhibit bimodal height distributions due to environmental factors.
-
Weather Patterns: Seasonal temperature variations can create bimodal distributions.
Bimodal Distributions in Social Sciences
Social sciences often deal with complex data that can exhibit bimodal distributions. Understanding these distributions can provide deeper insights into social phenomena.
-
Income Levels: Income distribution in a population can be bimodal, indicating economic disparity.
-
Voting Patterns: Political preferences can show bimodal distributions, reflecting polarized opinions.
-
Cultural Practices: Different cultural practices within a society can create bimodal distributions.
Statistical Tests for Bimodal Distributions
Several statistical tests can help identify and analyze bimodal distributions. Knowing these tests can improve the accuracy of data analysis.
-
Hartigan's Dip Test: Measures the multimodality of a distribution.
-
Bimodality Coefficient: A numerical measure to identify bimodal distributions.
Final Thoughts on Bimodal
Bimodal distribution isn't just a fancy term; it's a concept that pops up in everyday life. From weather patterns to stock market trends, understanding bimodal can help make sense of the world. It shows how data can have two peaks, revealing more than a single average ever could. This insight can be crucial for scientists, economists, and even students trying to grasp complex topics.
Knowing about bimodal distributions can also help in decision-making. For instance, businesses can better understand customer behavior, and educators can tailor teaching methods to different learning styles. So next time you see a graph with two peaks, you'll know there's more to the story. Keep an eye out for these patterns; they might just change how you see things.
Was this page helpful?
Our commitment to delivering trustworthy and engaging content is at the heart of what we do. Each fact on our site is contributed by real users like you, bringing a wealth of diverse insights and information. To ensure the highest standards of accuracy and reliability, our dedicated editors meticulously review each submission. This process guarantees that the facts we share are not only fascinating but also credible. Trust in our commitment to quality and authenticity as you explore and learn with us.