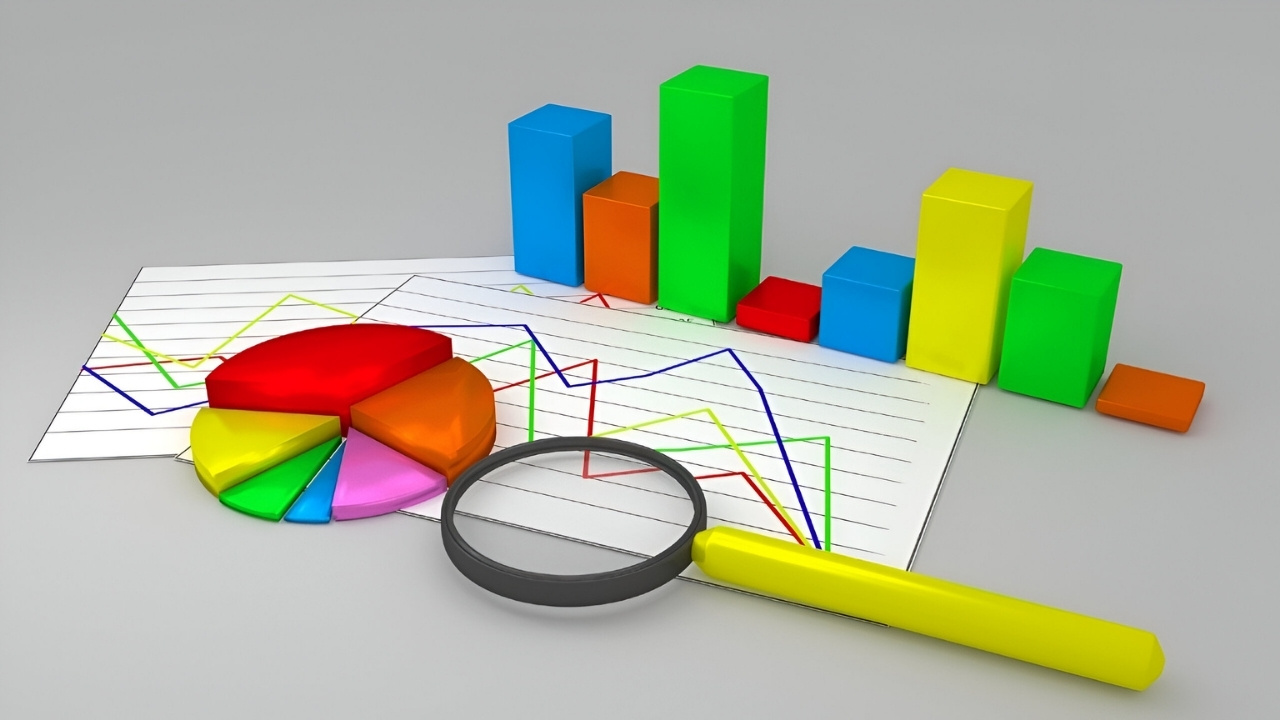
Graphs are everywhere! From school math classes to complex data analysis, they help us understand information visually. But did you know that graphs have a rich history and many interesting facts? Graphs can be simple like bar charts or complex like network diagrams. They are used in various fields such as science, business, and social media. Graphs can show relationships, trends, and patterns that might be hard to see in plain numbers. Whether you're a student, a data enthusiast, or just curious, learning about graphs can be both fun and useful. Ready to dive into the world of graphs? Let's get started!
What Are Graphs?
Graphs are visual representations of data. They help us understand complex information quickly and easily. Here are some fascinating facts about graphs that might surprise you.
-
The word "graph" comes from the Greek word "grapho," which means "to write."
-
Graphs can be used to represent various types of data, including numerical, categorical, and relational data.
-
The earliest known graph was created by Michael Florent van Langren in 1644 to show the difference in longitude between Toledo and Rome.
-
Bar graphs, line graphs, pie charts, and scatter plots are some of the most common types of graphs.
-
Graphs are used in many fields, including mathematics, science, economics, and social sciences.
Types of Graphs
Different types of graphs serve different purposes. Each type has its unique way of displaying data.
-
Bar graphs use rectangular bars to represent data values. The length of each bar is proportional to the value it represents.
-
Line graphs use points connected by lines to show changes in data over time. They are great for tracking trends.
-
Pie charts divide a circle into slices to represent proportions. Each slice's size is proportional to the data it represents.
-
Scatter plots use dots to represent values for two different variables. They help identify relationships between variables.
-
Histograms are similar to bar graphs but are used to represent the distribution of numerical data.
History of Graphs
Graphs have a rich history that dates back centuries. They have evolved significantly over time.
-
William Playfair, a Scottish engineer, is credited with inventing the line graph and bar chart in the late 18th century.
-
Florence Nightingale used polar area diagrams, a type of pie chart, to show the causes of mortality during the Crimean War.
-
In 1869, Charles Minard created a famous graph depicting Napoleon's Russian campaign. It is considered one of the best statistical graphics ever drawn.
-
The first known scatter plot was created by Francis Galton in the 19th century to study the relationship between parents' and children's heights.
-
The development of computers in the 20th century revolutionized graph creation, making it easier to generate complex graphs.
Uses of Graphs
Graphs are incredibly versatile and can be used in various ways to convey information.
-
In business, graphs are used to track sales, profits, and market trends.
-
Scientists use graphs to visualize experimental data and identify patterns.
-
In education, teachers use graphs to help students understand mathematical concepts.
-
Governments use graphs to present economic data, such as unemployment rates and GDP growth.
-
Sports analysts use graphs to track player performance and team statistics.
Fun Facts About Graphs
Graphs can be fun and interesting too! Here are some quirky facts.
-
The largest bar graph ever created was made by students in India. It measured 1,000 meters long!
-
Some people have a phobia of graphs, known as "graphophobia."
-
The term "infographic" is a blend of "information" and "graphic." Infographics often use graphs to present data visually.
-
Graph theory, a branch of mathematics, studies graphs and their properties. It has applications in computer science, biology, and social networks.
-
The famous "Four Color Theorem" in graph theory states that any map can be colored using just four colors without any adjacent regions sharing the same color.
Modern Graphs
With technology, graphs have become more advanced and interactive.
-
Interactive graphs allow users to explore data by zooming in, filtering, and hovering over data points for more information.
-
Data visualization tools like Tableau and Power BI make it easy to create complex graphs without programming knowledge.
-
Animated graphs can show changes in data over time, making trends easier to understand.
-
Virtual reality (VR) and augmented reality (AR) are being used to create immersive graph experiences.
-
Social media platforms like Twitter and Instagram use graphs to analyze user engagement and trends.
-
Machine learning algorithms can generate graphs to identify patterns and make predictions based on large datasets.
Graphs: More Than Just Lines and Dots
Graphs aren't just for math class. They help us understand complex data quickly. From bar graphs to pie charts, each type has its own use. Knowing which one to use can make your data more meaningful. Graphs also play a big role in technology, science, and business. They help us see trends, make decisions, and communicate information clearly.
Next time you see a graph, take a moment to appreciate its power. It's not just a bunch of lines and dots. It's a tool that can change how we see the world. Whether you're a student, a professional, or just curious, understanding graphs can give you a new perspective. So, keep exploring and learning. Graphs have a lot to offer, and they're more interesting than you might think.
Was this page helpful?
Our commitment to delivering trustworthy and engaging content is at the heart of what we do. Each fact on our site is contributed by real users like you, bringing a wealth of diverse insights and information. To ensure the highest standards of accuracy and reliability, our dedicated editors meticulously review each submission. This process guarantees that the facts we share are not only fascinating but also credible. Trust in our commitment to quality and authenticity as you explore and learn with us.
