


What is the Hertzsprung-Russell diagram? The Hertzsprung-Russell diagram (H-R diagram) is a crucial tool in astronomy that plots stars according to their brightness and temperature. Named after Ejnar Hertzsprung and Henry Norris Russell, this graph helps astronomers understand stellar evolution. Stars are categorized into groups like main sequence, giants, and white dwarfs. By examining a star's position on the H-R diagram, scientists can infer its age, size, and even its future. This diagram is essential for anyone curious about how stars live and die. Ready to dive into 25 fascinating facts about the H-R diagram? Let's get started!
What is the Hertzsprung-Russell Diagram?
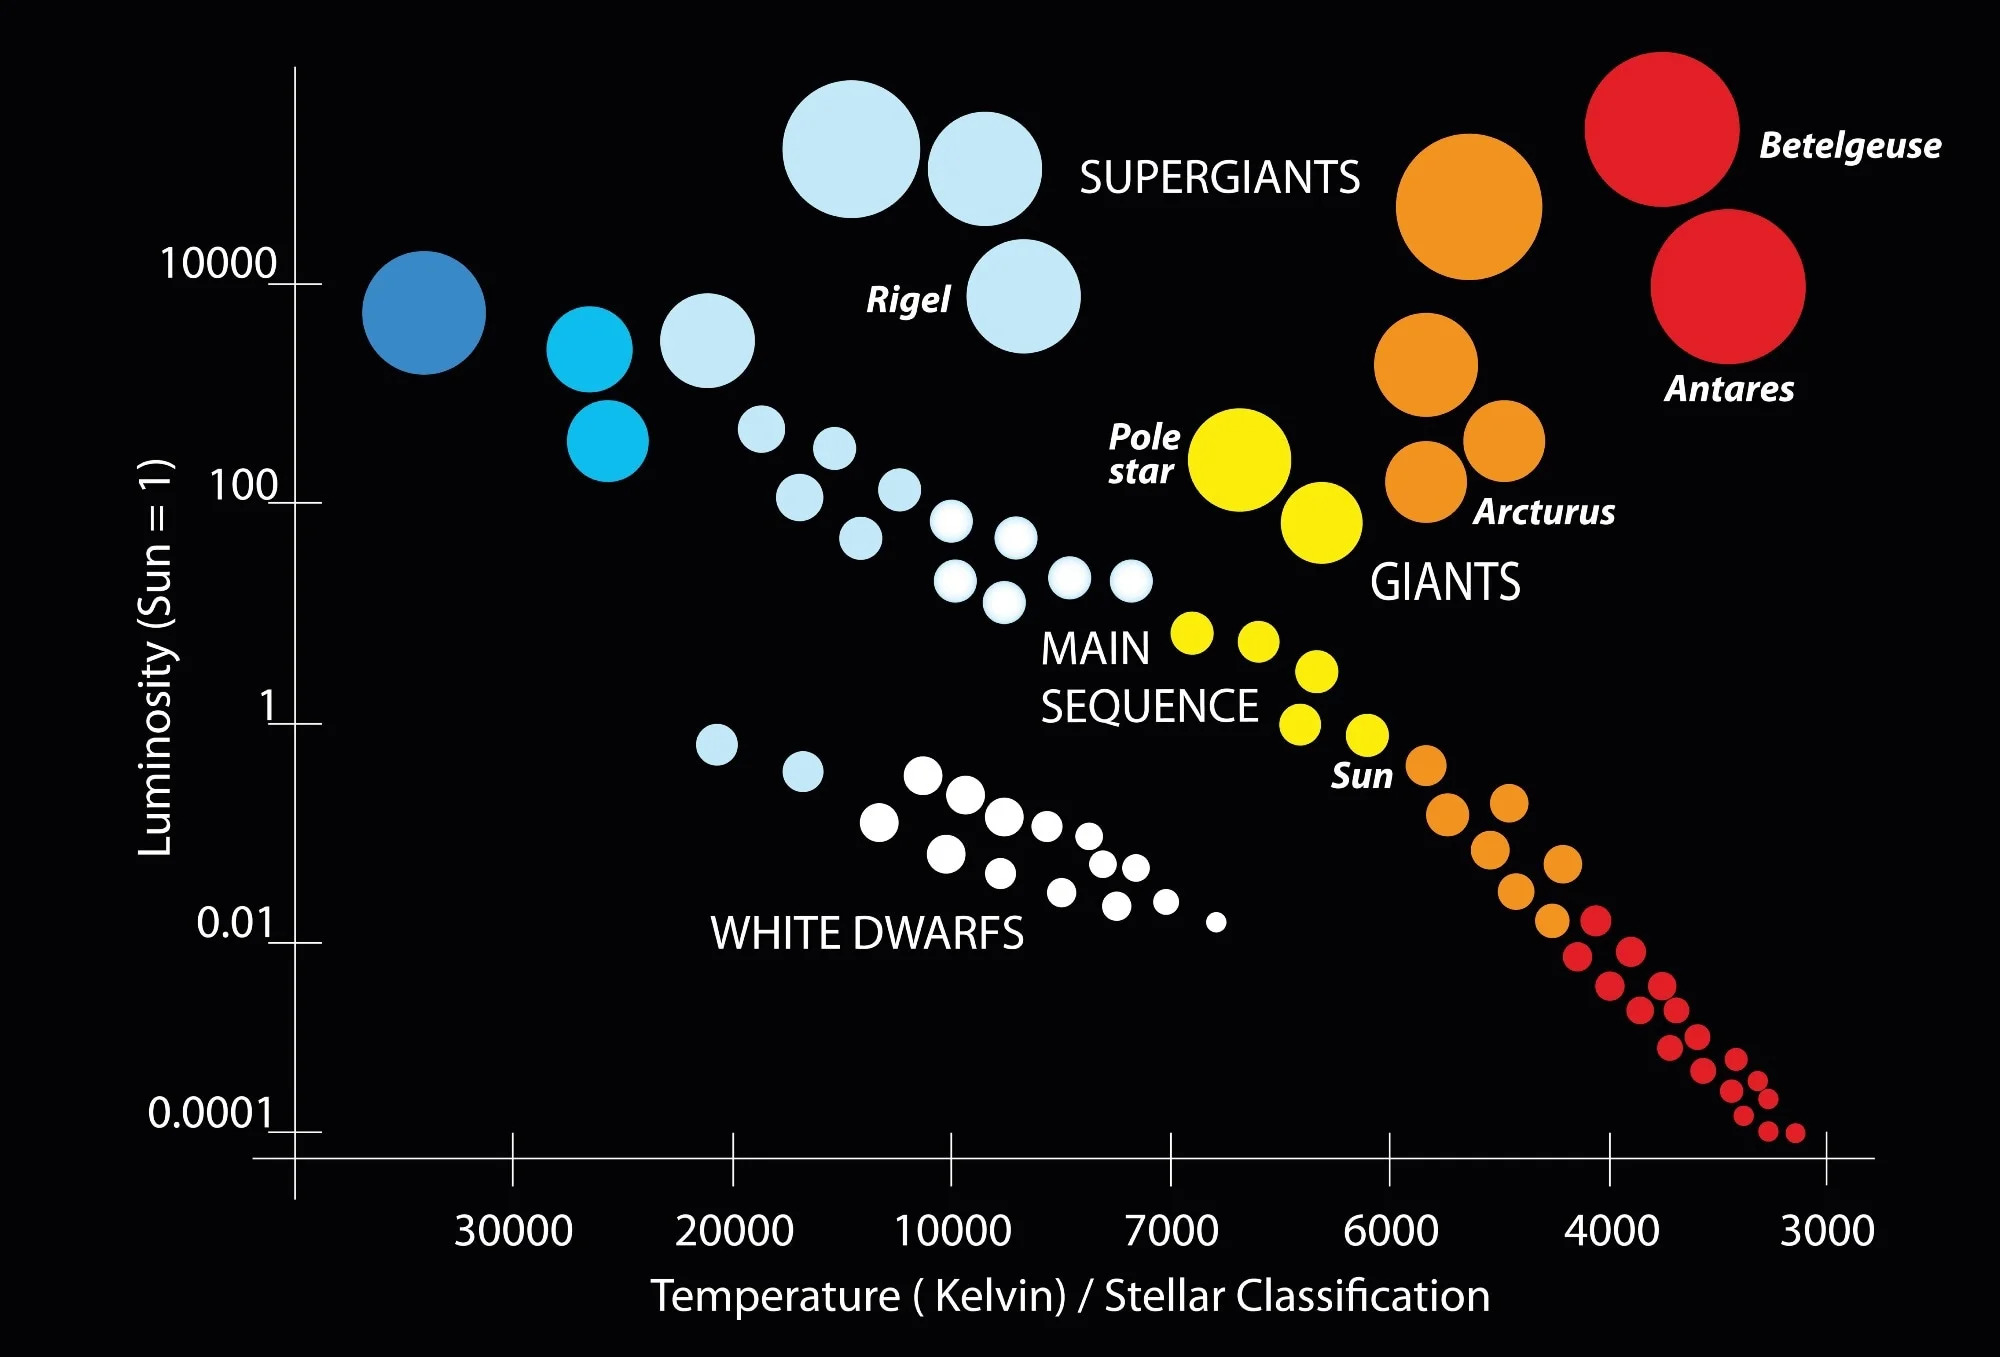
The Hertzsprung-Russell diagram (HR diagram) is a fundamental tool in the field of astronomy. It plots stars according to their luminosity and temperature, revealing patterns that help astronomers understand stellar evolution.
- The HR diagram was independently developed by Ejnar Hertzsprung and Henry Norris Russell in the early 20th century.
- It is a scatter plot with stars plotted by their absolute magnitude or luminosity against their spectral type or surface temperature.
- The diagram is divided into several regions, including the main sequence, giants, supergiants, and white dwarfs.
- Most stars, including our Sun, fall along the main sequence, where they spend the majority of their lifetimes.
- The position of a star on the HR diagram can indicate its age, chemical composition, and future evolution.
Main Sequence Stars
Main sequence stars are the most common type of stars found in the HR diagram. They are in a stable phase of their life cycle, fusing hydrogen into helium in their cores.
- Main sequence stars range from hot, blue O-type stars to cool, red M-type stars.
- The Sun is a G-type main sequence star, also known as a yellow dwarf.
- Stars on the main sequence follow a predictable pattern where hotter stars are more luminous.
- The mass of a main sequence star determines its position on the HR diagram; more massive stars are hotter and more luminous.
- Main sequence stars can remain in this phase for millions to billions of years, depending on their mass.
Giants and Supergiants
Giants and supergiants are stars that have exhausted the hydrogen in their cores and have moved off the main sequence. They are much larger and more luminous than main sequence stars.
- Giants are stars that have expanded and cooled after using up their core hydrogen.
- Supergiants are even larger and more luminous than giants, often thousands of times brighter than the Sun.
- Betelgeuse, a well-known red supergiant, is located in the upper right of the HR diagram.
- Giants and supergiants have short lifespans compared to main sequence stars, often only a few million years.
- These stars can end their lives in dramatic supernova explosions, leaving behind neutron stars or black holes.
White Dwarfs
White dwarfs are the remnants of stars that have shed their outer layers and no longer undergo fusion. They are found in the lower left of the HR diagram.
- White dwarfs are incredibly dense, with a mass similar to the Sun but a volume comparable to Earth.
- They are very hot when they first form but gradually cool over billions of years.
- The eventual fate of a white dwarf is to become a cold, dark "black dwarf," though the universe is not old enough for any black dwarfs to exist yet.
- Sirius B, the companion to the bright star Sirius, is one of the most famous white dwarfs.
- White dwarfs can sometimes reignite in a nova if they accrete enough material from a companion star.
The Importance of the HR Diagram
The HR diagram is a crucial tool for astronomers, providing insights into the life cycles of stars and the structure of galaxies.
- It helps astronomers determine the distances to stars by comparing their apparent and absolute magnitudes.
- The HR diagram can reveal the age of star clusters by plotting their stars and identifying the turn-off point from the main sequence.
- It has been instrumental in confirming the theory of stellar evolution, showing how stars change over time.
- The diagram also aids in the study of variable stars, whose positions on the HR diagram change as they pulsate.
- By understanding the HR diagram, astronomers can better grasp the processes that govern the birth, life, and death of stars.
The Final Word on the Hertzsprung-Russell Diagram
The Hertzsprung-Russell diagram is a cornerstone in astronomy. It helps scientists understand stellar evolution, classify stars, and even estimate the age of star clusters. From the main sequence to the giant and dwarf stars, this diagram maps out the life cycles of stars in a way that's both simple and profound. Whether you're an astronomy enthusiast or just curious about the universe, knowing how to read this diagram can deepen your appreciation for the stars. It's not just a chart; it's a window into the cosmos. So next time you gaze at the night sky, remember that each star has a story, and the Hertzsprung-Russell diagram is the key to unlocking those stellar tales.
Was this page helpful?
Our commitment to delivering trustworthy and engaging content is at the heart of what we do. Each fact on our site is contributed by real users like you, bringing a wealth of diverse insights and information. To ensure the highest standards of accuracy and reliability, our dedicated editors meticulously review each submission. This process guarantees that the facts we share are not only fascinating but also credible. Trust in our commitment to quality and authenticity as you explore and learn with us.