


Covariance might sound like a complex term, but it’s actually quite simple. It measures how two variables change together. If you’ve ever wondered why certain things seem to rise or fall in tandem, covariance is the answer. For example, when ice cream sales go up, so do temperatures. This relationship can be positive, negative, or zero. A positive covariance means both variables move in the same direction, while a negative one indicates they move in opposite directions. Zero covariance? No relationship at all. Understanding covariance helps in fields like finance, statistics, and science. Ready to dive into 36 fascinating facts about covariance? Let’s get started!
What is Covariance?
Covariance is a statistical measure that indicates the extent to which two variables change together. It helps in understanding the relationship between variables in a dataset. Here are some intriguing facts about covariance:
-
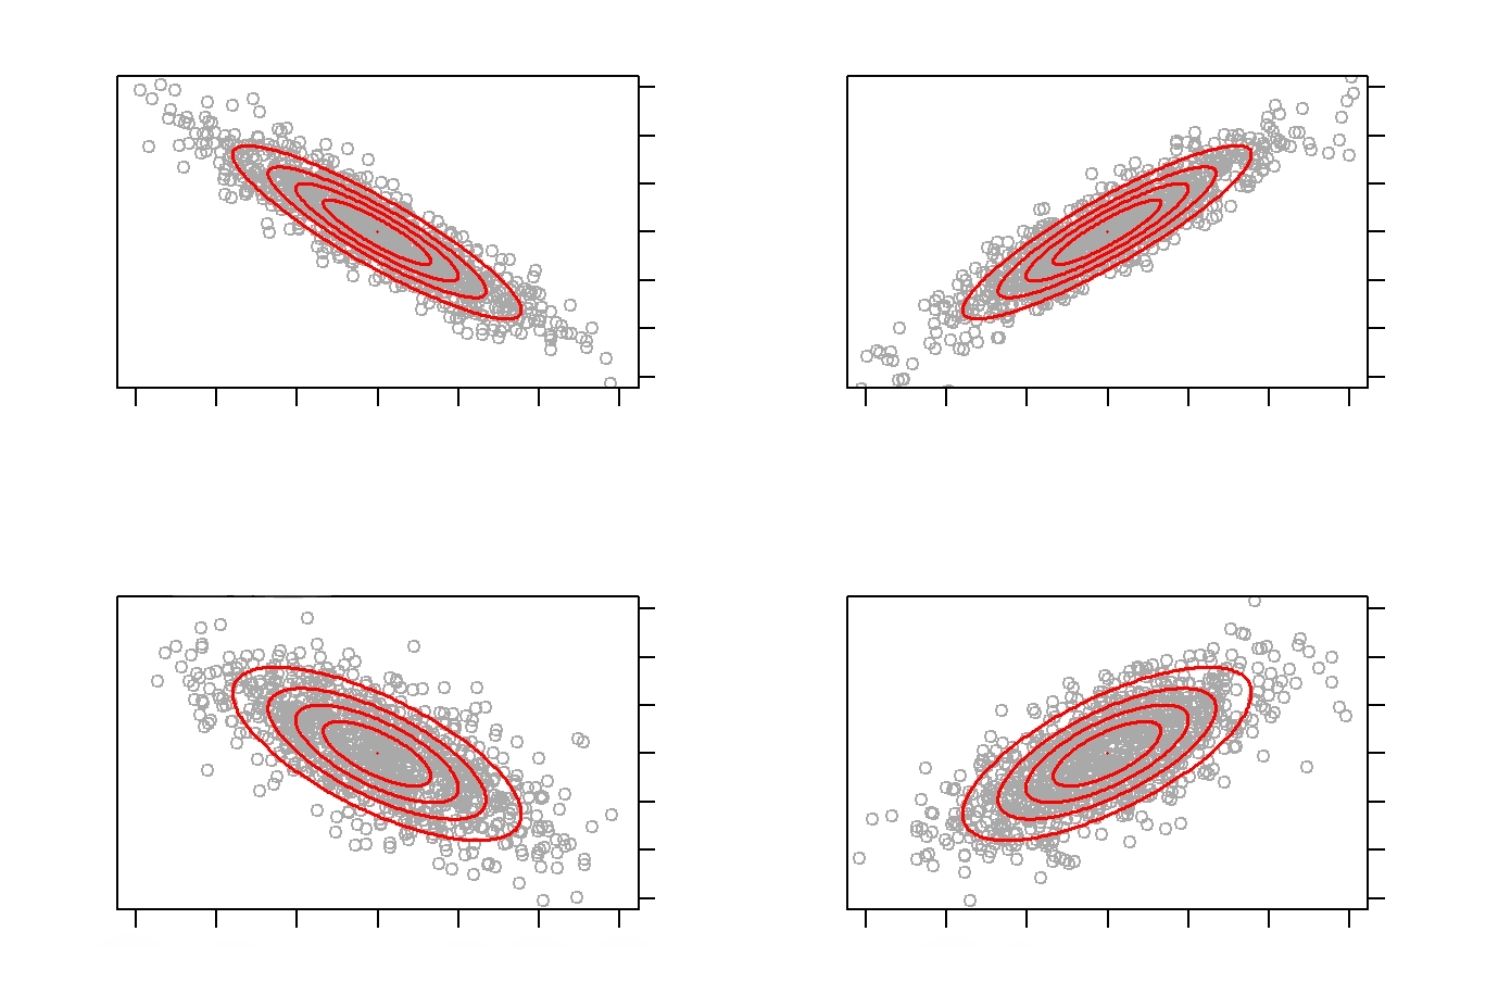
Covariance can be positive, negative, or zero. Positive covariance means that as one variable increases, the other tends to increase. Negative covariance indicates that as one variable increases, the other tends to decrease. Zero covariance means there is no relationship between the variables.
-
The formula for covariance between two variables X and Y is:
[
text{Cov}(X, Y) = frac{sum (X_i – bar{X})(Y_i – bar{Y})}{n – 1}
]
where (X_i) and (Y_i) are individual data points, (bar{X}) and (bar{Y}) are the means of X and Y, and (n) is the number of data points. -
Covariance is measured in units that are the product of the units of the two variables. For example, if X is measured in meters and Y in seconds, the covariance will be in meter-seconds.
-
Covariance is sensitive to the scale of the variables. If the units of the variables change, the covariance value will also change.
-
Covariance is used in finance to measure how two stocks move together. A positive covariance means that the stocks tend to move in the same direction, while a negative covariance means they move in opposite directions.
Covariance vs. Correlation
While covariance and correlation both measure the relationship between two variables, they are not the same. Here are some key differences:
-
Correlation is a standardized version of covariance. It is dimensionless and ranges from -1 to 1.
-
The formula for correlation is:
[
text{Corr}(X, Y) = frac{text{Cov}(X, Y)}{sigma_X sigma_Y}
]
where (sigma_X) and (sigma_Y) are the standard deviations of X and Y. -
Correlation is easier to interpret than covariance because it is standardized. A correlation of 1 means a perfect positive relationship, -1 means a perfect negative relationship, and 0 means no relationship.
-
Covariance can be any value, while correlation is always between -1 and 1.
-
Correlation is not affected by the scale of the variables, unlike covariance.
Applications of Covariance
Covariance has various applications in different fields. Here are some interesting uses:
-
In finance, covariance is used to construct portfolios that minimize risk. By combining assets with low or negative covariance, investors can reduce the overall risk of their portfolio.
-
Covariance is used in machine learning algorithms, such as Principal Component Analysis (PCA), to reduce the dimensionality of data.
-
In meteorology, covariance is used to study the relationship between different weather variables, such as temperature and humidity.
-
Covariance is used in genetics to study the relationship between different genetic traits.
-
In economics, covariance is used to analyze the relationship between different economic indicators, such as GDP and unemployment rate.
Calculating Covariance
Calculating covariance involves several steps. Here’s a simplified explanation:
-
First, calculate the mean of each variable.
-
Subtract the mean of each variable from each data point to get the deviations.
-
Multiply the deviations of the two variables for each data point.
-
Sum the products of the deviations.
-
Divide the sum by the number of data points minus one.
Properties of Covariance
Covariance has some unique properties that are important to understand:
-
Covariance is symmetric. This means that (text{Cov}(X, Y) = text{Cov}(Y, X)).
-
If two variables are independent, their covariance is zero. However, a covariance of zero does not necessarily mean the variables are independent.
-
Covariance is linear. This means that (text{Cov}(aX + b, Y) = a cdot text{Cov}(X, Y)), where (a) and (b) are constants.
-
The covariance of a variable with itself is equal to its variance. (text{Cov}(X, X) = text{Var}(X)).
-
Covariance can be affected by outliers, which can distort the measure of the relationship between the variables.
Covariance Matrix
A covariance matrix is a square matrix that shows the covariance between each pair of variables in a dataset. Here are some facts about covariance matrices:
-
The diagonal elements of a covariance matrix are the variances of the variables.
-
The off-diagonal elements are the covariances between the variables.
-
A covariance matrix is symmetric, meaning that the element in the i-th row and j-th column is equal to the element in the j-th row and i-th column.
-
Covariance matrices are used in multivariate statistics to understand the relationships between multiple variables.
-
In machine learning, covariance matrices are used in algorithms like PCA to identify the principal components of the data.
Practical Examples of Covariance
Understanding covariance can be easier with practical examples. Here are a few:
-
In a study of students' test scores, covariance can show the relationship between scores in math and science. A positive covariance would indicate that students who score high in math also tend to score high in science.
-
In a business context, covariance can be used to analyze the relationship between advertising spend and sales revenue. A positive covariance would suggest that higher advertising spend is associated with higher sales revenue.
-
In environmental science, covariance can be used to study the relationship between air pollution levels and respiratory health issues. A positive covariance would indicate that higher pollution levels are associated with more health issues.
-
In sports, covariance can be used to analyze the relationship between training hours and performance. A positive covariance would suggest that more training hours are associated with better performance.
-
In agriculture, covariance can be used to study the relationship between rainfall and crop yield. A positive covariance would indicate that more rainfall is associated with higher crop yield.
-
In psychology, covariance can be used to analyze the relationship between stress levels and sleep quality. A negative covariance would suggest that higher stress levels are associated with poorer sleep quality.
Covariance in a Nutshell
Covariance measures how two variables change together. Positive covariance means they move in the same direction, while negative covariance means they move in opposite directions. It's crucial in statistics, finance, and data analysis. Understanding covariance helps in portfolio management, risk assessment, and identifying relationships between variables.
Covariance isn't always easy to interpret on its own. That's where correlation comes in, standardizing covariance to a range between -1 and 1. This makes it easier to understand the strength and direction of relationships.
Remember, covariance is sensitive to the scale of the data. Always consider the units and context when interpreting results.
By grasping these basics, you can better analyze data and make informed decisions. Covariance might seem complex, but with practice, it becomes a valuable tool in your analytical toolkit.
Was this page helpful?
Our commitment to delivering trustworthy and engaging content is at the heart of what we do. Each fact on our site is contributed by real users like you, bringing a wealth of diverse insights and information. To ensure the highest standards of accuracy and reliability, our dedicated editors meticulously review each submission. This process guarantees that the facts we share are not only fascinating but also credible. Trust in our commitment to quality and authenticity as you explore and learn with us.