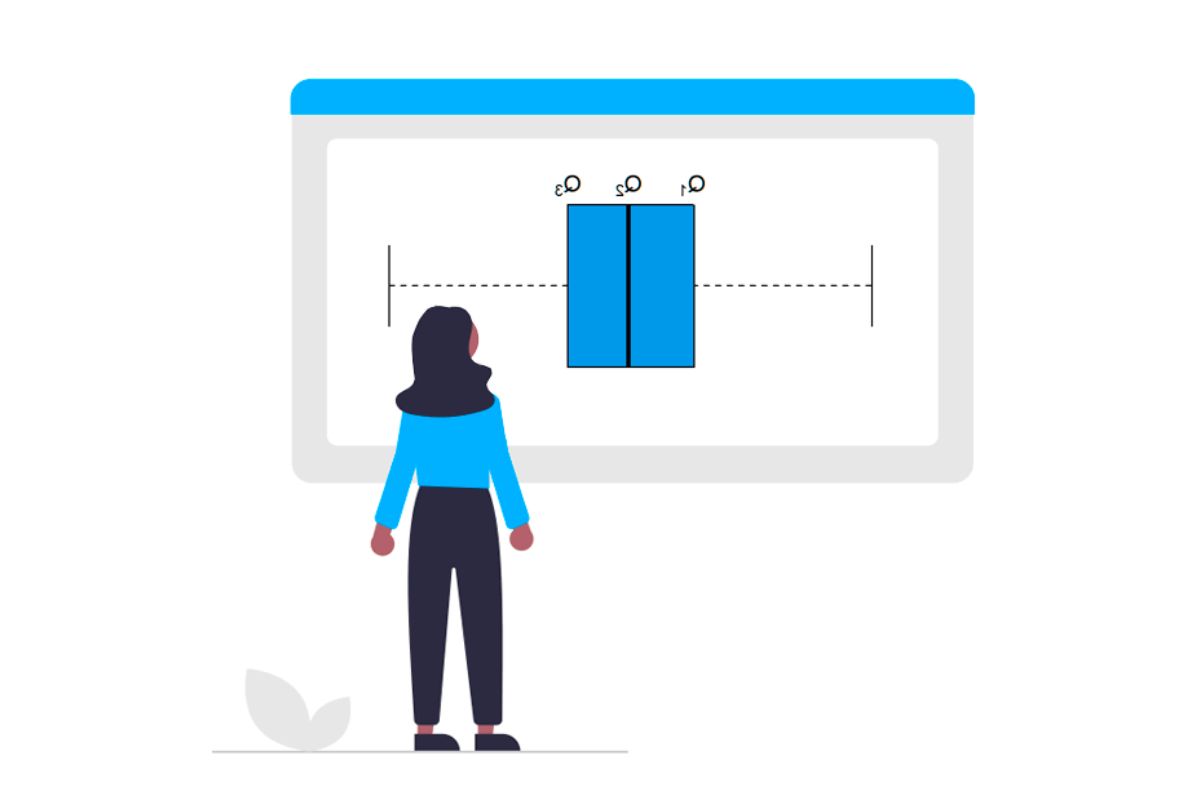
Quantiles are a powerful tool in statistics, helping us understand data distributions by dividing them into equal-sized intervals. But what exactly are quantiles, and why are they so important? Quantiles split data into segments, making it easier to analyze and interpret large datasets. They are used in various fields like finance, economics, and even meteorology. For example, the median is a type of quantile that divides data into two equal parts. Understanding quantiles can help you make better decisions based on data. Ready to dive into 32 fascinating facts about quantiles? Let's get started!
What is a Quantile?
Quantiles are points in a distribution that divide data into equal-sized intervals. They help in understanding the spread and distribution of data. Let's dive into some fascinating facts about quantiles.
-
Quantiles divide data into equal parts. For example, quartiles split data into four equal parts, while percentiles divide it into 100 parts.
-
Median is a type of quantile. The median is the 50th percentile, meaning it divides the data into two equal halves.
-
Quartiles are common quantiles. Quartiles include the first quartile (25th percentile), the second quartile (50th percentile or median), and the third quartile (75th percentile).
-
Quantiles are used in statistics. They help in summarizing data distributions, making it easier to understand large datasets.
How Quantiles are Calculated
Calculating quantiles involves sorting data and finding specific positions within the dataset. Here are some interesting facts about the calculation process.
-
Data must be ordered. To calculate quantiles, data must first be sorted in ascending order.
-
Interpolation is sometimes used. When the desired quantile position falls between two data points, interpolation helps estimate the value.
-
Different methods exist. Various algorithms can calculate quantiles, each with its own approach to handling data.
-
Software tools assist in calculations. Programs like R, Python, and Excel have built-in functions to compute quantiles.
Applications of Quantiles
Quantiles have numerous applications in different fields. They are essential in statistics, finance, and even machine learning.
-
Risk management in finance. Quantiles help assess financial risk by identifying extreme values in data distributions.
-
Grading systems in education. Percentiles are often used to rank students' performance relative to their peers.
-
Quality control in manufacturing. Quantiles help monitor product quality by identifying deviations from the norm.
-
Weather forecasting. Quantiles assist in predicting extreme weather events by analyzing historical data.
Types of Quantiles
There are various types of quantiles, each serving a unique purpose. Here are some key types and their uses.
-
Percentiles. Divide data into 100 equal parts, useful for detailed analysis.
-
Deciles. Split data into 10 equal parts, often used in economic studies.
-
Quartiles. Divide data into four equal parts, commonly used in box plots.
-
Tertiles. Split data into three equal parts, useful in medical research.
Quantiles in Machine Learning
Quantiles play a crucial role in machine learning, helping improve model performance and interpretability.
-
Feature scaling. Quantile transformation helps normalize data, making it easier for models to learn.
-
Outlier detection. Quantiles help identify and handle outliers, improving model accuracy.
-
Model evaluation. Quantile regression evaluates model performance by predicting different points in the distribution.
-
Data preprocessing. Quantiles assist in transforming data, making it more suitable for machine learning algorithms.
Quantiles and Data Visualization
Quantiles are essential in data visualization, helping create clear and informative charts.
-
Box plots. Use quartiles to display data distribution and identify outliers.
-
Histograms. Quantiles help determine bin widths, making histograms more informative.
-
Cumulative distribution plots. Quantiles assist in visualizing the cumulative distribution of data.
-
Heatmaps. Quantiles help create heatmaps by dividing data into equal intervals.
Quantiles in Research
Quantiles are vital in research, helping analyze and interpret data across various fields.
-
Epidemiology. Quantiles help identify trends and patterns in disease outbreaks.
-
Economics. Quantiles assist in analyzing income distribution and economic inequality.
-
Psychology. Quantiles help study behavioral patterns and cognitive processes.
-
Environmental science. Quantiles assist in analyzing pollution levels and climate change data.
Fun Facts about Quantiles
Quantiles have some interesting and lesser-known aspects. Here are a few fun facts to wrap up our exploration.
-
Quantiles date back to the 19th century. Sir Francis Galton, a British scientist, introduced the concept in the late 1800s.
-
Quantiles are used in sports. Percentiles help rank athletes' performance and compare them to their peers.
-
Quantiles in genetics. Quantiles help analyze genetic data and identify patterns in gene expression.
-
Quantiles in marketing. Quantiles assist in segmenting customers based on purchasing behavior and preferences.
The Final Word on Quantile
Quantiles break data into equal parts, making it easier to understand and analyze. They’re used in various fields like finance, education, and meteorology. Knowing how to use quantiles can help you make better decisions based on data. For example, in finance, quantiles can help assess risk by showing how returns are distributed. In education, they can identify student performance levels. Meteorologists use quantiles to predict weather patterns.
Understanding quantiles isn’t just for experts. Anyone can benefit from knowing how to interpret data this way. It’s a handy tool for making sense of large datasets and spotting trends. Whether you’re a student, a professional, or just curious, learning about quantiles can give you a new perspective on data. So next time you come across a dataset, try breaking it down into quantiles. You might be surprised at what you find!
Was this page helpful?
Our commitment to delivering trustworthy and engaging content is at the heart of what we do. Each fact on our site is contributed by real users like you, bringing a wealth of diverse insights and information. To ensure the highest standards of accuracy and reliability, our dedicated editors meticulously review each submission. This process guarantees that the facts we share are not only fascinating but also credible. Trust in our commitment to quality and authenticity as you explore and learn with us.
