


What is a Lineweaver-Burk plot? A Lineweaver-Burk plot is a graphical representation used in biochemistry to understand enzyme kinetics. It transforms the Michaelis-Menten equation into a straight line, making it easier to determine key parameters like the maximum reaction rate (Vmax) and the Michaelis constant (Km). This plot is particularly useful for identifying types of enzyme inhibition. By plotting the reciprocal of the reaction rate against the reciprocal of the substrate concentration, scientists can gain clearer insights into how enzymes interact with substrates. Whether you're a student or a seasoned researcher, understanding this plot can significantly enhance your grasp of enzyme behavior.
What is a Lineweaver-Burk Plot?
A Lineweaver-Burk plot is a graphical representation used in biochemistry to analyze enzyme kinetics. It transforms the Michaelis-Menten equation into a linear form, making it easier to determine key parameters like the maximum reaction rate and the Michaelis constant.
- The Lineweaver-Burk plot is also known as a double reciprocal plot.
- It was named after Hans Lineweaver and Dean Burk, who introduced it in 1934.
- This plot is used to determine the type of enzyme inhibition.
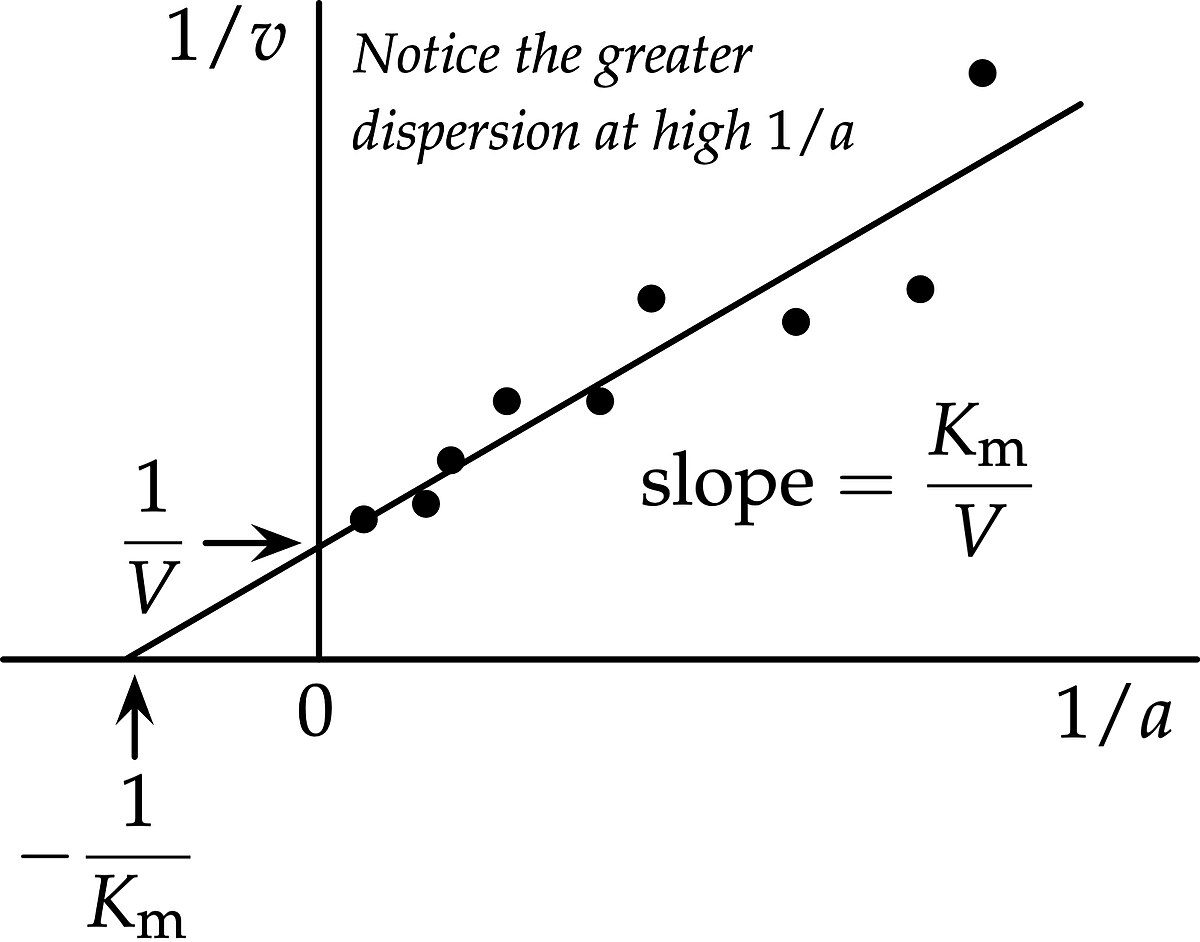
- The x-axis represents the reciprocal of substrate concentration (1/[S]).
- The y-axis represents the reciprocal of reaction velocity (1/V).
How to Construct a Lineweaver-Burk Plot
Creating a Lineweaver-Burk plot involves plotting the reciprocals of substrate concentrations and reaction velocities. This method simplifies the analysis of enzyme kinetics.
- To construct the plot, you need experimental data of substrate concentrations and reaction velocities.
- Calculate the reciprocal of each substrate concentration (1/[S]).
- Calculate the reciprocal of each reaction velocity (1/V).
- Plot these values on a graph with 1/[S] on the x-axis and 1/V on the y-axis.
- Draw the best-fit line through the plotted points.
Interpreting the Lineweaver-Burk Plot
Understanding the plot helps in determining important kinetic parameters and the type of enzyme inhibition.
- The y-intercept of the plot represents 1/Vmax, where Vmax is the maximum reaction velocity.
- The x-intercept represents -1/Km, where Km is the Michaelis constant.
- The slope of the line is Km/Vmax.
- A steeper slope indicates a higher Km or a lower Vmax.
- The plot can help distinguish between competitive, non-competitive, and uncompetitive inhibition.
Advantages of Using Lineweaver-Burk Plot
Despite some limitations, the Lineweaver-Burk plot offers several advantages in enzyme kinetics studies.
- It provides a straightforward way to determine Vmax and Km.
- The linear form makes it easier to identify different types of enzyme inhibition.
- It allows for quick visual comparison of different enzyme reactions.
- The plot can be used to analyze both single-substrate and multi-substrate reactions.
- It helps in understanding the mechanism of enzyme action.
Limitations of Lineweaver-Burk Plot
While useful, the Lineweaver-Burk plot has some drawbacks that researchers should be aware of.
- The plot can exaggerate errors in data at low substrate concentrations.
- It may not be accurate for enzymes with very high or very low Km values.
- The linear transformation can distort the true relationship between substrate concentration and reaction velocity.
- Alternative plots like the Eadie-Hofstee plot or Hanes-Woolf plot can sometimes provide more reliable results.
- The plot assumes that enzyme kinetics follow Michaelis-Menten behavior, which may not always be the case.
Applications of Lineweaver-Burk Plot
The Lineweaver-Burk plot is widely used in various fields of biochemistry and pharmacology.
- It helps in drug development by identifying potential enzyme inhibitors.
- The plot is used in studying metabolic pathways and enzyme regulation.
- It aids in the design of enzyme assays and diagnostic tests.
- Researchers use it to compare the kinetic properties of different enzymes.
- The plot is a valuable tool in teaching enzyme kinetics to students.
Understanding the Lineweaver-Burk plot is essential for anyone studying enzyme kinetics. It provides a clear and concise way to analyze and interpret enzyme behavior, despite its limitations.
The Final Word on Lineweaver-Burk Plots
Lineweaver-Burk plots simplify enzyme kinetics. They transform Michaelis-Menten equations into straight lines, making it easier to determine Vmax and Km. This method helps identify enzyme inhibitors, crucial for drug development and biochemical research. Despite some limitations, like sensitivity to experimental error, Lineweaver-Burk plots remain a valuable tool.
Understanding these plots can deepen your grasp of enzyme behavior. They offer a clear visual representation, aiding in the interpretation of complex data. Whether you're a student, researcher, or just curious, mastering Lineweaver-Burk plots can enhance your scientific toolkit.
So, next time you encounter enzyme kinetics, remember the power of a Lineweaver-Burk plot. It’s a straightforward, effective way to analyze and understand the intricate dance of enzymes and substrates. Happy plotting!
Was this page helpful?
Our commitment to delivering trustworthy and engaging content is at the heart of what we do. Each fact on our site is contributed by real users like you, bringing a wealth of diverse insights and information. To ensure the highest standards of accuracy and reliability, our dedicated editors meticulously review each submission. This process guarantees that the facts we share are not only fascinating but also credible. Trust in our commitment to quality and authenticity as you explore and learn with us.